02.16.10
Posted in Non-US Weather, Weather News at 12:15 am by Rebekah
Not to sound like a broken record, but while the southern US is enduring more cold air today and expecting more probably later on in this week or next, the northwestern US and much of Canada is enjoying (or not, if you’re an Olympic skier) record warm temperatures.
Vancouver’s normal temperature for today is 46.4 °F (8 °C). Any time you hear “normal” in reference to the weather or climate, that means the weather variable was averaged over a 30-year-period, currently 1971 to 2000. Today’s observed high was 54.3 °F (12.4 °C), only 0.4 °F (0.2 °C) below a record temperature!
Seattle is 3.8 °F warmer than normal this month. For the Ellensburg/Yakima area in central Washington, back where I grew up, the average monthly temperatures this year for January and February (so far) are 36.0 °F and 41.3 °F. Contrast that with the normal average temperatures for January and February: 29.8 °F and 36.0 °F (or even last year, 30.2 °F and 34.8 °F). It’s pretty clear to see that temperatures in the Northwest (and Canada) are well above normal this winter.
What’s in store for the next couple of weeks or so?
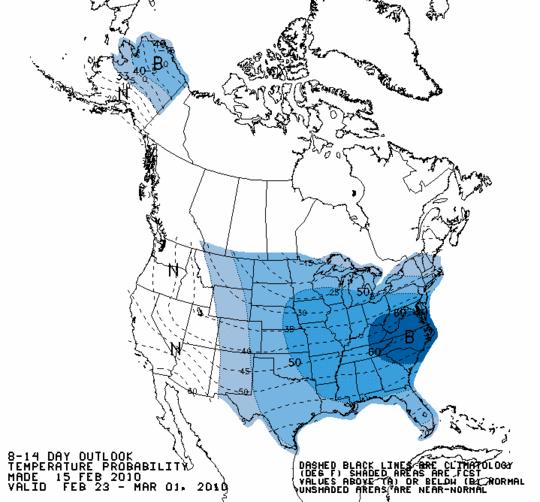
Below is an 8-14-day forecast temperature map of the US (from the Climate Prediction Center); blue shading indicates temperatures below normal. All I can say is it’s warmer in southern Alaska than it is here in Oklahoma.
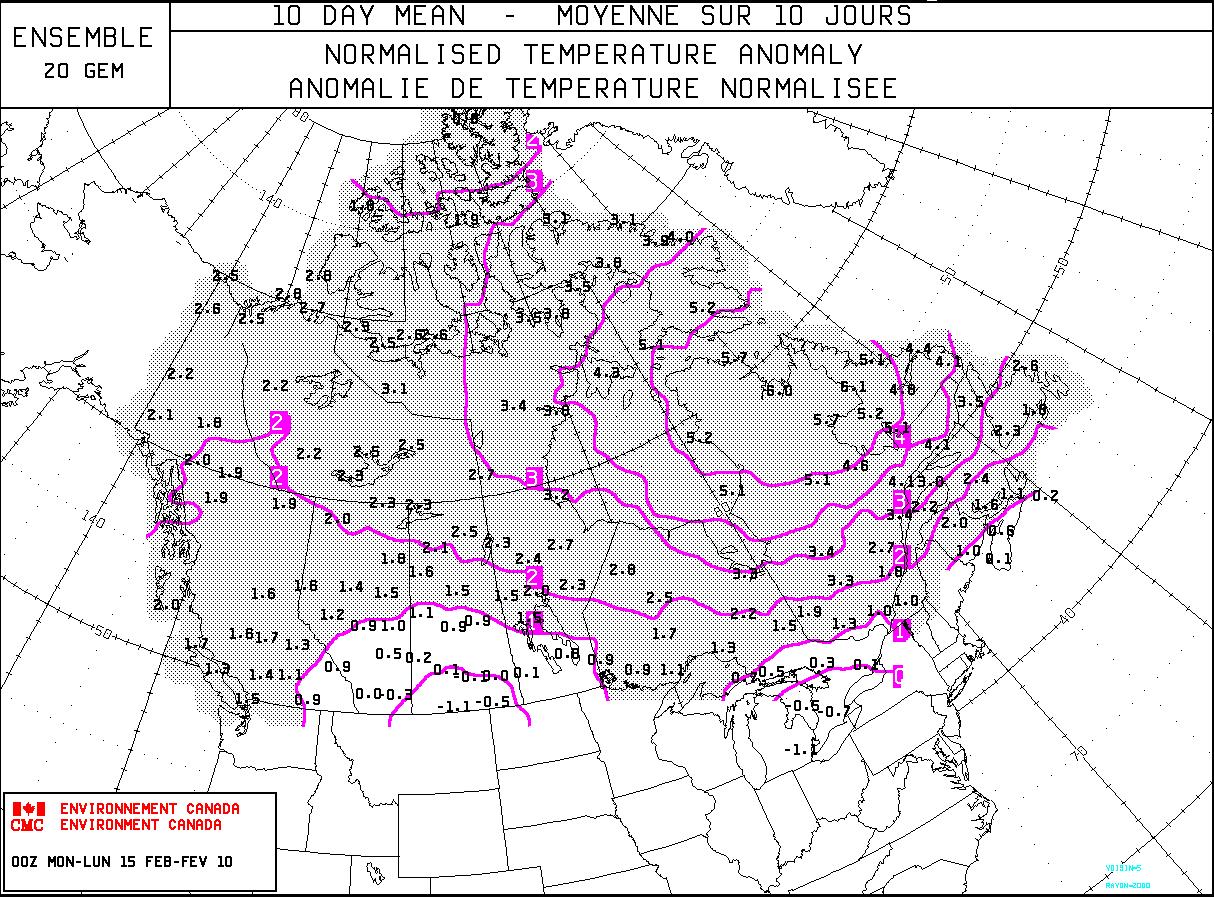
Below shows an updated map (click to enlarge) of Canada’s 10-day temperature outlook–what a surprise, more above-normal weather for the rest of the Olympics! Bad news for outdoor events at Cypress Mountain, near Vancouver…but the mountains around Whistler are at least experiencing record snowfall, ironically.
Permalink
02.12.10
Posted in Non-US Weather, Weather News at 9:37 pm by Rebekah
The winter Olympics began today in Vancouver and Whistler. The breath-taking shots of Canada and the Vancouver area that have been shown during the opening ceremonies tonight are beyond description. I miss the beauty of the Pacific Northwest so much; all the more so when I see such stunning images.
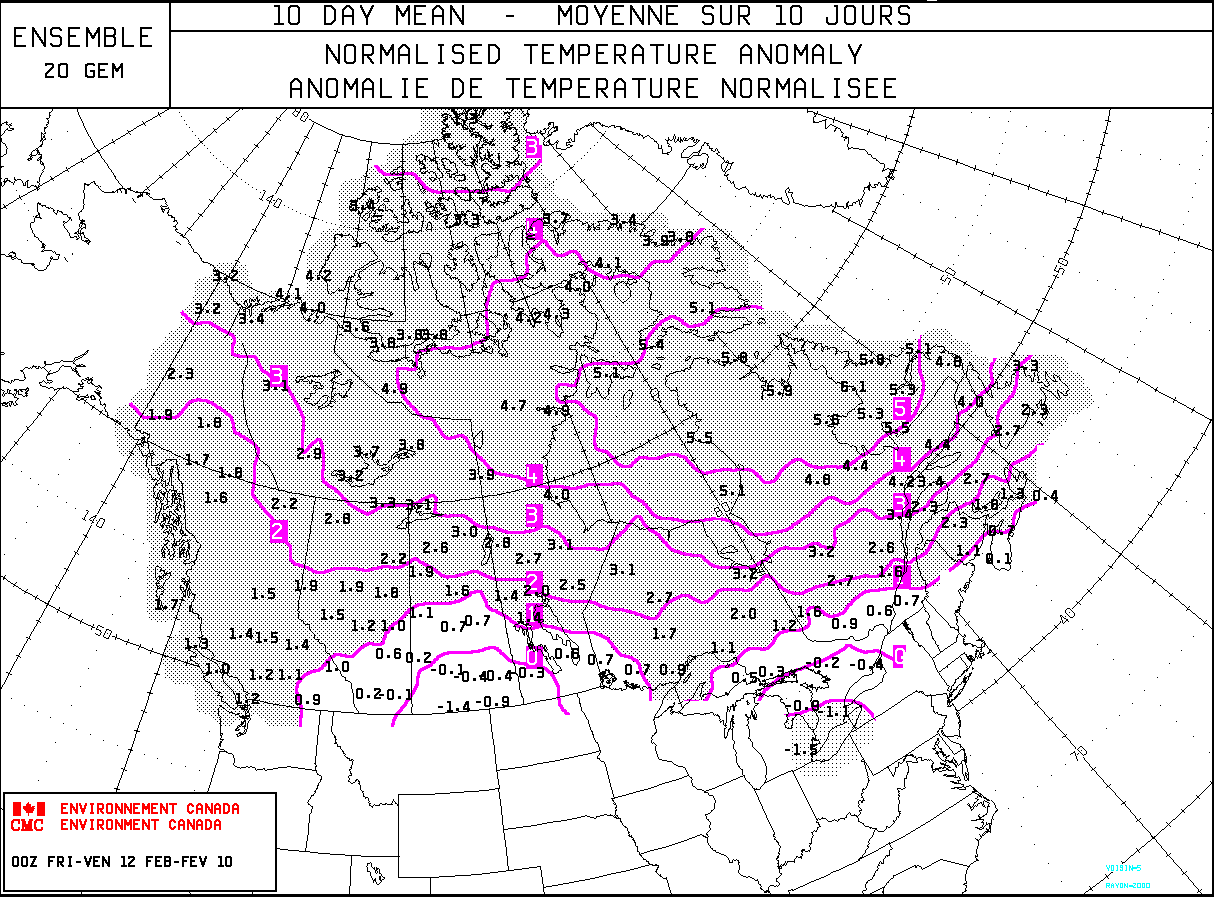
You may have heard that Vancouver is experiencing a warm and dry winter. However, on the up side, Whistler (where many of the outdoor events will take place) has already received record snowfall this year. What’s in store for the next two weeks of the Olympics? The following image shows a model forecast of Canada’s temperature anomaly (departure from normal, in degrees Celsius) over the next 10 days. As you can see, most of the country is experiencing and expecting above-normal temperatures!
So why has it been warm and dry in the North, but cold in the South and East? To continue from yesterday’s post, some of this has to do with El Niño. However, there are many other climate anomalies that affect temperature and precipitation patterns. One such anomaly is the North Atlantic Oscillation (NAO).
There is a semi-permanent low-pressure center near Iceland, called the Icelandic Low. There is also a semi-permanent high-pressure center near the Azores, called the Azores or Bermuda High. A positive NAO means both the high and the low are stronger, thus there is a stronger pressure gradient from high to low pressure. Storms tend to take a northwest track that bring warmer and wetter winters to northern Europe while eastern US winters tend to be mild.
A negative NAO means both the high and low are weaker (and sometimes shift their positions). Typical climate patterns include cold and dry winters in northern Europe and cold winters in the south central and eastern US. The following image is a graph of positive and negative NAOs.
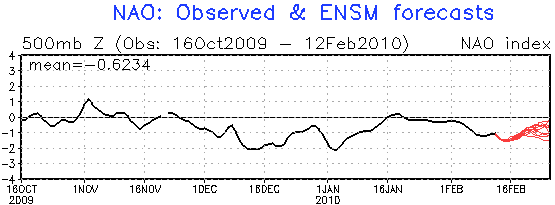
Note that during the cold stretch of weather in mid-December in the eastern two-thirds of the country, there was a moderately negative NAO. Also note that there was a moderately negative NAO during the cold period in early January. The red lines at the end of the graph show several models’ forecasts for the NAO phase–according to this, it looks like the cold weather may not yet be over, which agrees with model temperature forecasts for the next week and a half!
So cold plus moisture (remember El Niño) equals snow…which is what we’ve obviously been getting a lot of lately in the South and the East. In the meantime, the Northwest remains dry and mild. There is another climate anomaly that affect temperature and moisture in the Northwest, and it is called the Pacific Decadal Oscillation (PDO). Not much is known yet about the PDO, but we do notice that a negative PDO tends to bring colder temperatures and a positive PDO tends to bring warmer temperatures. We started the winter in a negative PDO, which was probably responsible in some part for the cold, snowy weather in the Northwest early in the winter. However, unfortunately for Vancouver, the PDO has gone back towards the neutral phase, thus the warming effects of El Niño are able to take over a little more.
There are some pretty amazing visual effects going on in the opening ceremony of the Olympics right now. The use of projectors to make the stadium look like ice or water or whales or whatever is pretty cool. Go US (and then Canada!)! 🙂
Permalink
02.11.10
Posted in Weather News at 11:59 pm by Rebekah
Two days ago I saw a Robin in a tree near my apartment. I rejoiced, as I grew up with the notion that the first Robin of the year meant spring was on its way.
However, today in Norman we received nearly an inch of snow! The Dallas/Fort Worth airport received 8.7 inches today, breaking their record for the most snow in a day! Obviously, winter isn’t quite ready to release its icy grip yet.
The South is breaking snow records left and right, the East Coast is digging out of 3-ft+ of record-setting snow, California has been pummeled by storm system after storm system this winter, while the Pacific Northwest has been warmer than normal.
What’s going on? In the news, you may have seen a number of articles or TV segments where people are arguing over whether this winter is a sign of global warming, global cooling, or neither. As many scientists have said, it is foolish to look at just one year of extremes and to say that climate change is or is not occurring. Weather is the state of the atmosphere at any given time or place. Climate is the average weather at any given place over a long period of time. A singular weather event may be incorporated into a long-term average of weather, but one event does not give us enough information to infer anything about climate change.
On the other hand, there is a much more likely explanation for this winter’s wild weather, and I think it has a lot to do with natural, periodic, short-lived climate anomalies. Ever heard of El Niño? El Niño is one such climate anomaly that results in a warming of equatorial waters off the coast of Peru.
Normally, trade winds in the tropics blow from east to west. These winds push warm surface waters towards Australia. Near Peru, cold water rises up to take the place of the water that was pushed westward (this process is called upwelling). During an El Niño, the trade winds weaken or possibly even reverse direction. Warm, tropical waters stay warm across the equatorial Pacific and upwelling decreases or stops. This abnormal warming affects pressure patterns aloft (or the other way around; it’s a feedback process), which in turn may affect weather across the US. La Niña, which I’ll only mention briefly, is sort-of the opposite of an El Niño, where we just see “normal” go a little too far, so upwelling is stronger and cold waters are colder than normal.
El Niño is at its strongest during the winter, when the subtropical jet stream is expected to become stronger than the polar jet stream. A stronger, more west-east oriented, southern jet will quickly bring many storm systems and a lot of moisture from the Pacific into the southern United States, while the Northwest will not get as many storm systems and will tend to be warmer and drier. We are currently coming down from the peak of a moderate El Niño, and we have certainly been seeing a strong southern jet stream bringing a lot of rain to California and a lot of moisture and storms to the Southern Plains.
The figure below is a graph of the MEI (Multivariate ENSO Index) since 1950, a measure of the strength of El Niños; positive values (in red) indicate an El Niño while negative values (in blue) indicate a La Niña.

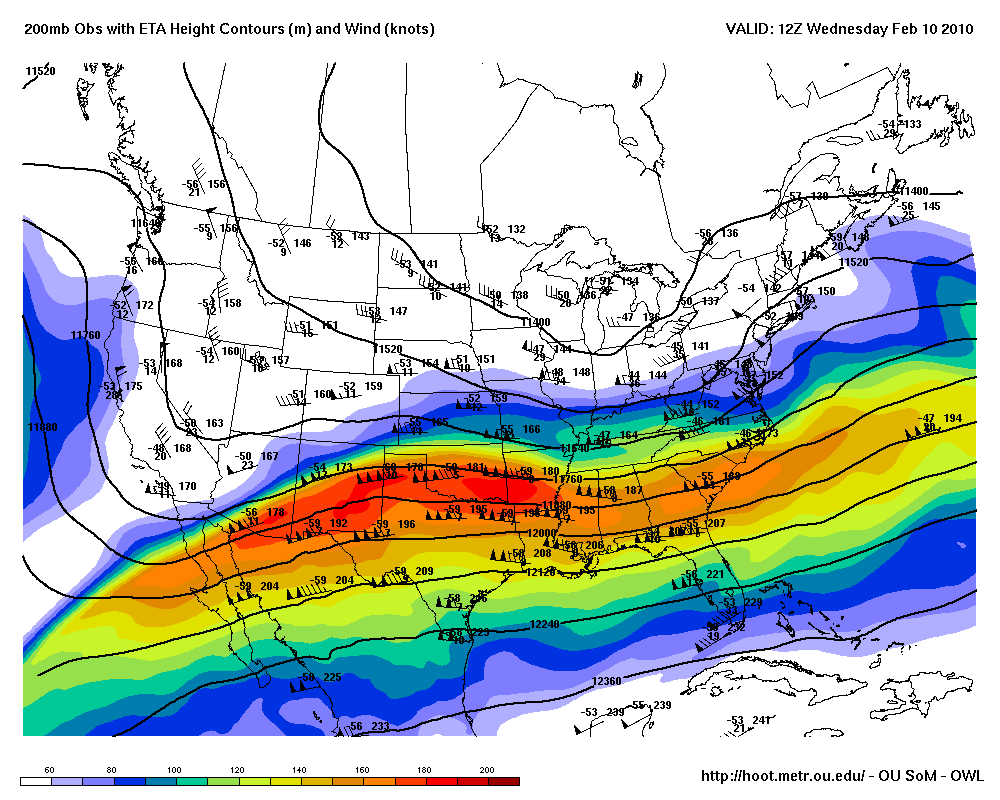
The following image is an upper-air map at 200mb (near the top of the troposphere), showing the strong winds of the jet stream oriented west-east across the southern US (it was from Wednesday morning, 12Z).
This is only part of the story, though…there is another climate anomaly that occurs in the North Atlantic that could be linked to the cold air in the South and the East. I’ll talk about that in the next post!
Back to where I began–it is supposed to warm up to the mid-50s here on Saturday, but then we should get hit by yet another sub-freezing air mass…so that poor Robin had better stay away a while longer!
Permalink
02.10.10
Posted in General News at 5:35 pm by Rebekah
I haven’t been working on the website much in the past couple of weeks as I have been too busy taking care of other irons in the fire. I would like to display a current weather banner on the forecast page of my website, along with some recent and relevant weather maps and a discussion, but I was not able to find any customizable banners that I liked. So…I decided to try my hand at designing my own. So far I have written several hundred lines of code in Perl that will take encoded weather observations from the National Weather Service, translate them into English, and display the results. However, currently the display is nothing fancy; so now I’m using my limited knowledge of Visual Basic to write code that will display the info in a “pretty” format. Stay tuned…hopefully I can get at least a prototype up and running in the next couple of weeks, depending on my other work.
I just received some good news today. My paper (based on my master’s thesis work on lightning) is one step closer to being published! I met with my previous adviser (from my M.S.) today, and after reading my draft last week, he thinks it looks pretty good! Most of his comments on the draft were regarding minor revisions, so it looks like the biggest part I’ll have to expand on will be the conclusions, as I had expected.
I also met with a professor in the OU School of Meteorology today to discuss PhD research ideas. I’m currently teaching this year, but looking for funding in meteorology/GIS. Very good news–his research ideas sound amazingly interesting, and he would like to have me work on the project! He is currently putting the finishing touches on a grant that he expects to be accepted in another month or two (probably the end of April by the latest). Without going into too much detail here, suffice it to say it would be another project in lightning, but with more of a spatial analysis angle. I would work on developing some new tools for visualizing and analyzing lightning data and then use those tools to answer some questions about lightning (mostly cloud-to-ground) and why it strikes where it does.
Tomorrow I hope to post on a few reasons as to why this winter has been the way it has been…primarily focusing on the cold and snow in the South and East. Hint: it may have something to do with a couple of little phenomena called the NAO and El Niño. Then on Friday…it’s the start of the Vancouver/Whistler winter Olympics! I’ll try to get some time to post on what the weather’s going to be like…will it snow or will it rain?
Permalink
02.03.10
Posted in Weather News at 11:24 pm by Rebekah
…that is the question: whether ’tis nobler in the mind to suffer the slings and arrows of outrageous snowstorms…oh, whatever.
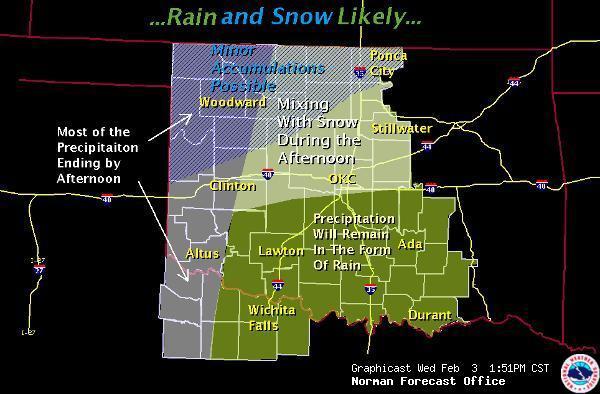
There’s a slight chance of in Oklahoma City and points north tomorrow…and a greater chance next week (even here) with the colder weather. However, the NWS is advertising it as “very wet” snow, as the temperature may only be marginal for snow (at least tomorrow…colder weather is coming again next week).
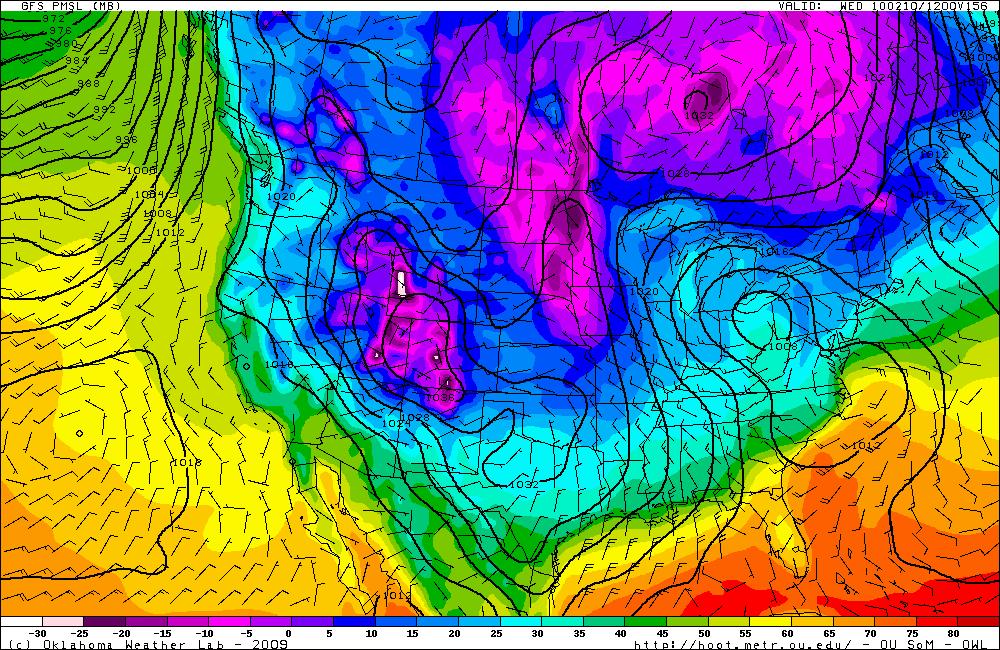
GFS model for 12Z Wednesday, showing a temperature in Norman of about 20F…the NWS is going with 14F for now, though, probably as the models tend to run a little warm this far out (lines are surface pressure, showing high over west central US):

How many days until the first chase setup in the southern Plains?
Permalink
« Previous Page — « Previous entries « Previous Page · Next Page » Next entries » — Next Page »


