01.14.11
Posted in Winter Weather at 8:00 am by Rebekah
On January 12, 1888, an arctic cold front swept through the Great Plains, bringing temperature drops from the upper 30s to minus 20 °F (minus 40 °F in the Northern Plains), strong winds, and heavy snow.
Thousands of people were caught out in the cold and snow, as the blizzard was very sudden, it struck during work and school hours, and many people were outside as the temperatures leading up to the passage of the front were fairly mild. At least 235 people died in the storm, many of them children in the Dakotas and Nebraska, walking home in the blizzard and/or freezing in the arctic temperatures (hence the name “Schoolhouse Blizzard” or “Children’s Blizzard”).
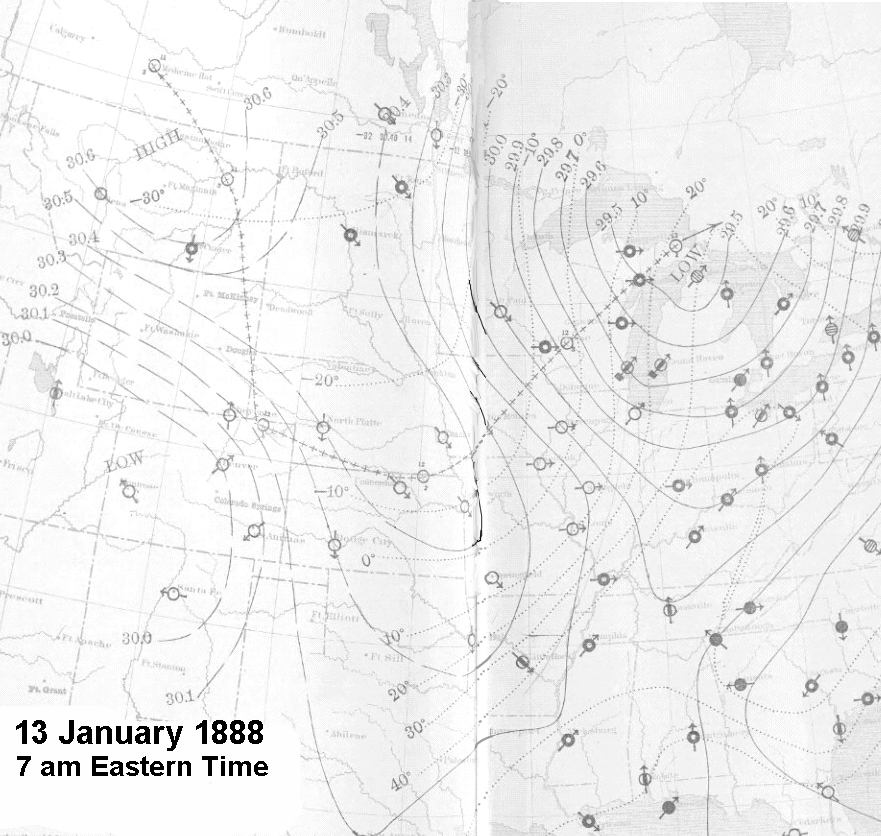
Map of temperatures and pressure on the morning after the blizzard. Click to enlarge. Source: Wikipedia
My grandmother’s grandparents, father, and aunts and uncles got to experience this blizzard from southwest Iowa. Here is the story as she heard it from her father (Julius), some 70 years ago.
Written by Izetta (Kiersch) LaBar:
———————-
BLIZZARD OF JANUARY 12, 1888
The day dawned slightly cloudy, uneventful, and just like all the other January days had been. A foot of snow lay on level places, and the temperature was warm enough to make good snowballs. Frank, Dora, and Charley were through school and at home; also at home, because they were too young to attend school, were John, Agnes, and Harry. Those who attended school that day were Julius and Bertha. At that time the teacher was boarding with the Kierschs.
The day went as usual, with the dismissal at 4 and the sky still somewhat cloudy. The two children and the teacher started home across the field, following an old oxen trail which was already rutted too deep to use in four trails, though a fifth trail was still being used. They dallied along, snowballing as they went, until at about 4:30 the perfect calm of the day was suddenly broken. Without any warning a blizzard was upon them, and they were only halfway home. The gale was so strong they could hardly stand; yet they had to go on. They must keep moving. The teacher kept her head and marched straight west to a fence that they knew very well – it must be there to guide them if they could find it. Straight, straight west, and they reached the fence at last. Now the problem was to follow it south to another fence, which would lead them home. How could they keep their sense of direction so well, did they worry for fear they might be going the wrong way? Who knew what their thoughts were? The snow was soon two feet deeper, but follow the fence they must to the south end of it. At last here was the east and west fence along the familiar county line road; now to follow it west for home. Being worn into a depression the road was already drifted full.
They floundered through the deep snow step by step, and were unable to take one more step when at last they reached the door. There they found mother and Dora in tears, worrying and wailing about the fate that must have overtaken the two children. Such a relief! There was a bustle of removing thoroughly soaked clothing, warming the three up, and finding dry clothing for them. In the midst of the flurry, father stomped in covered from head to foot with blizzard snow. He had survived the two-mile fight along the railroad track from Bill Boehm’s, where he had gone earlier in the day to make a cutter with his neighbor’s help. Even a man of his strength had had his worries too, fighting the icy blasts. His first words, after barely having entered the door were: “Sind die Kinder Heim?” (Are the children home?)
The blizzard blew for three days, making drifts up to the eaves of the house on the south side. The cattle sheds were covered with snow, and the inside was full too, except for in a small spot where the cattle had milled around, and now were standing with their heads and hair all full of snow and ice. Drifts of snow all over the place were so solid, the cattle could walk right over all of the fences.
The trains didn’t come through for a week, but when the snowplow finally showed up it had three locomotives. They got stuck in the cut west of the house, and had to shovel to get backward to make a long run for this six or eight foot drift. Julius, Frank, and August Fieselman were standing above on the bank watching. When they finally got themselves shook off, dug out, and eyes wiped the engines were two miles up the track!
———————-
Permalink
01.13.11
Posted in Weather - Miscellaneous, Weather Education at 8:00 am by Rebekah
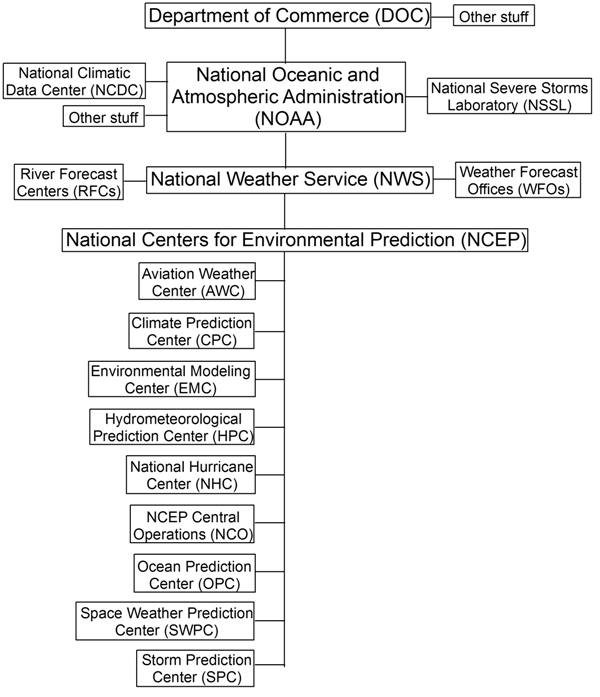
Here’s how NOAA, the NWS, and all of those other weather-related offices you hear about are connected. For more, read on.
The National Oceanic and Atmospheric Administration (NOAA) is part of the Department of Commerce. NOAA’s basic mission is to forecast and research conditions of the oceans and atmosphere.
NOAA has many branches, including the National Climatic Data Center (NCDC) in Asheville, North Carolina, the world’s largest active archive of weather data; the National Severe Storms Laboratory (NSSL) in Norman, Oklahoma, a weather research department; and the National Weather Service (NWS), headquartered in Silver Spring, Maryland.
The National Weather Service also has a few branches, including what most people are most familiar with, the local weather forecast offices (WFOs). There are 122 WFOs across the U.S., each charged with the duty of issuing local forecasts and warnings to the general public. The NWS also has 13 River Forecast Centers (RFCs), each of which issues, well, river forecasts.
The National Centers for Environmental Prediction (NCEP), headquartered in Camp Springs, Maryland, is also part of the NWS. There are nine branches of NCEP:
- Aviation Weather Center (AWC) in Kansas City, Missouri – provides aviation warnings and forecasts of hazardous flight conditions for domestic and international air space
- Climate Prediction Center (CPC) in Camp Springs, Maryland – monitors and forecasts short-term climate fluctuations
- Environmental Modeling Center (EMC) in Camp Springs, Maryland – develops and improves numerical weather, climate, hydrological, and ocean prediction via research
- Hydrometeorological Prediction Center (HPC) in Camp Springs, Maryland – provides nationwide analysis and forecast products (with an emphasis on precipitation) out through seven days
- National Hurricane Center (NHC) in Miami, Florida – provides tropical weather forecasts and issues watches and warnings for the U.S. and surrounding areas
- NCEP Central Operations (NCO) in Camp Springs, Maryland – maintains and runs operational analyses and forecast models
- Ocean Prediction Center (OPC) in Camp Springs, Maryland – issues weather warnings and forecasts out to five days for the Atlantic and Pacific Oceans north of 30°N
- Space Weather Prediction Center (SWPC) in Boulder, Colorado – provides space weather alerts and warnings for disturbances that can affect people and equipment working in space and on earth
- Storm Prediction Center (SPC) in Norman, Oklahoma – provides tornado and severe thunderstorm watches for the contiguous U.S. along with a suite of hazardous weather forecasts
The National Weather Service was originally called the Weather Bureau. The Weather Bureau was established in 1870 under the War Department, but moved to the Department of Agriculture in 1890. In 1940, it was moved to the Department of Commerce, and in 1967, it became known as the National Weather Service. For more on the history of the NWS, see the NWS timeline and history pages.
Permalink
01.12.11
Posted in Tropical Weather, Weather News at 8:00 am by Rebekah
Last winter we experienced a moderately strong El Niño (see A Confused Robin and NWS Weather School), which was blamed in part for the snow and ice storms in the southern U.S. and the mild and dry weather in the Pacific Northwest (remember the winter Olympics?).
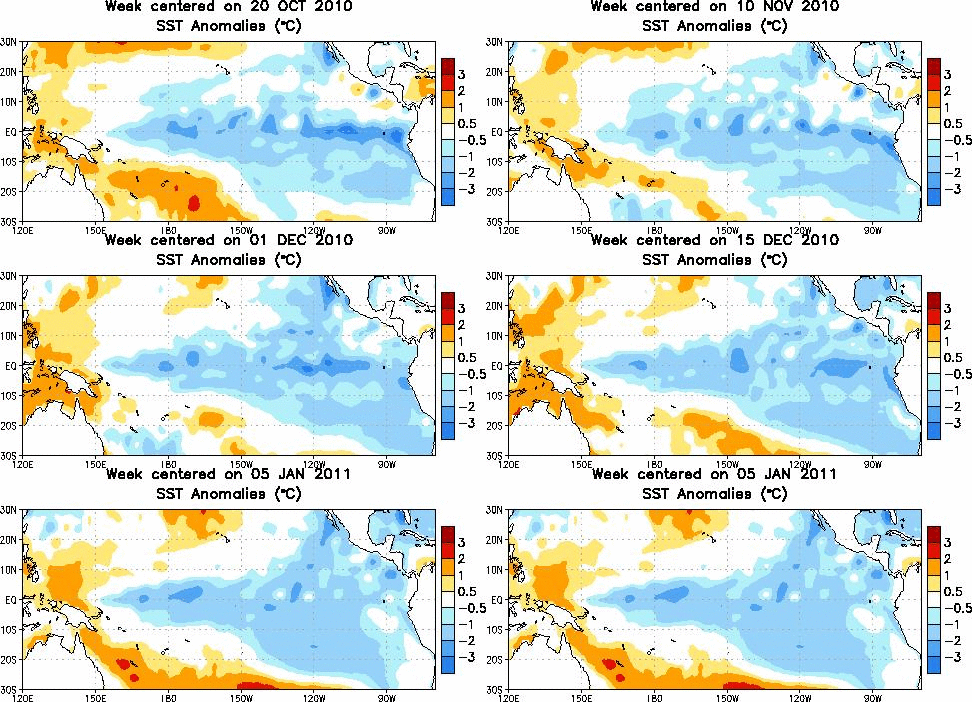
This winter, however, we are in the midst of a strong La Niña; one of the strongest on record, in fact.
What are El Niño and La Niña?
Normally, trade winds in the tropics blow from east to west. These winds push warm surface waters towards Australia (the western Pacific also has a lower typical surface pressure than the central Pacific, because of convergence occurring when the surface winds reach Australia and other islands). Near Peru, cold water rises up to take the place of the water that was pushed westward (this process is called upwelling).
During an El Niño, the trade winds weaken or possibly even reverse direction. Warm, tropical waters stay warm across the equatorial Pacific and upwelling decreases or stops.
La Niña is sort-of the opposite of an El Niño, where we just see “normal” go a little too far, in a manner of speaking, so upwelling is stronger and cold waters are colder than normal.
Current Events
Note in the figure above, from the Climate Prediction Center, the sea-surface temperatures across the tropics have lately been quite a bit cooler than normal, indicating a La Niña pattern.
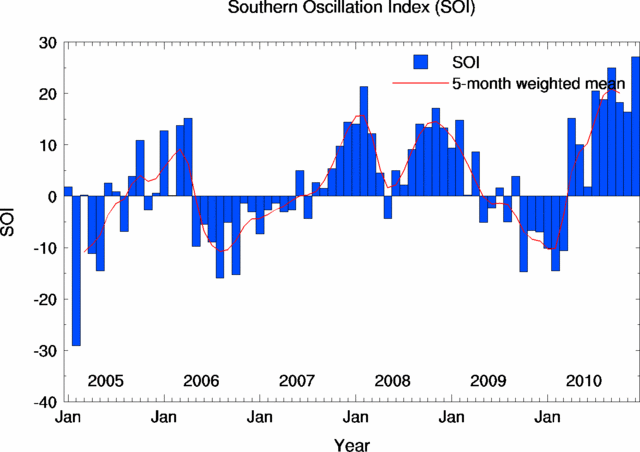
The Southern Oscillation Index (SOI), an Australian Bureau of Meteorology index for measuring the strength of El Niño / La Niña events (subtracts the surface pressure at Darwin, Australia from the surface pressure at Tahiti), has just recorded some of the highest positive (La Niña) values in history, including the highest value ever for December and the highest value since November 1973!
What does this mean for our weather?
Here’s a typical winter pattern for La Niña, from NOAA (bearing in mind that many other factors and ocean/pressure oscillations may affect the weather):
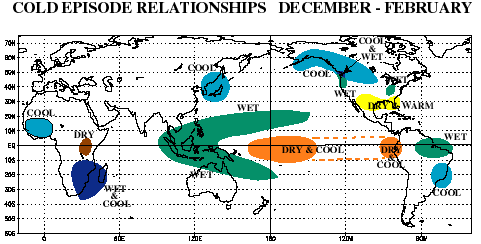
A couple of things to note: the Pacific Northwest was wetter than normal in December, but not necessarily cooler than normal. The Southwest and south central U.S. was warmer and drier than normal, but the Southeast (in fact all of the East) was quite a bit colder than normal and drier than normal. (To see recent climate maps, check out the CPC page here.)
Also, remember all the flooding going on in eastern Australia? Brisbane, the country’s third largest city, is currently bracing for record flooding. That’s due in some part to La Niña…various low-pressure systems and summer thunderstorms have aided in historic rainfalls and flooding. (Check out this video of cars being swept downstream in a flash flood in Toowoomba, Queensland.) Waters off the East Coast of Australia are also warmer than normal, which would help in producing convective showers.
Permalink
01.11.11
Posted in Weather News, Winter Weather at 9:06 pm by Rebekah
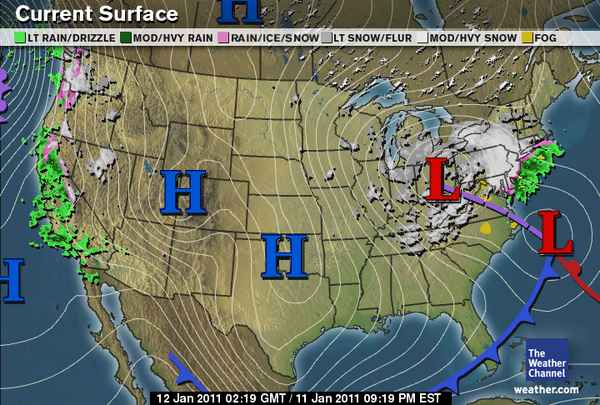
Tonight’s surface analysis from The Weather Channel shows most of the U.S. in the grips of a strong, large area of high pressure. This high pressure has ushered in cold, dry air for much of the U.S.
Perhaps the biggest story tonight, though, is that the low pressure center over Ohio, associated with a deep, upper-level trough, should merge late tonight with the low moving up the Atlantic Coast. This secondary low is what tracked along the Gulf Coast early in the week, aiding in the snow and ice storms of the Southeast.
As the smaller low moves up the coast tonight, an area of upper-level divergence on the east side of the trough (what’s causing the low in Ohio) will cause the surface low to intensify. The two areas of surface low pressure will appear to merge below the trough, and the pressure of the resulting surface low is expected to rapidly drop.
Models are showing that the pressure of this low could drop by 28 millibars in 24 hours, which is well within the definition of a “bomb cyclone” (low pressure center drop of 24 millibars in 24 hours). Currently, the pressure of both lows is about 1012 mb.
This extratropical cyclone / nor’easter is expected to result in several inches of snowfall across the Northeast, starting tonight.
In other news, there is also an extratropical cyclone off the Pacific Coast, and this is responsible for strong winds and rain and wintry precipitation along the West Coast. Western Washington and northwestern Oregon are already receiving snow and freezing rain.
Permalink
Posted in Non-US Weather, Weather News at 8:00 am by Rebekah
This week’s post in the global weather and climate series features Antananarivo, Madagascar.
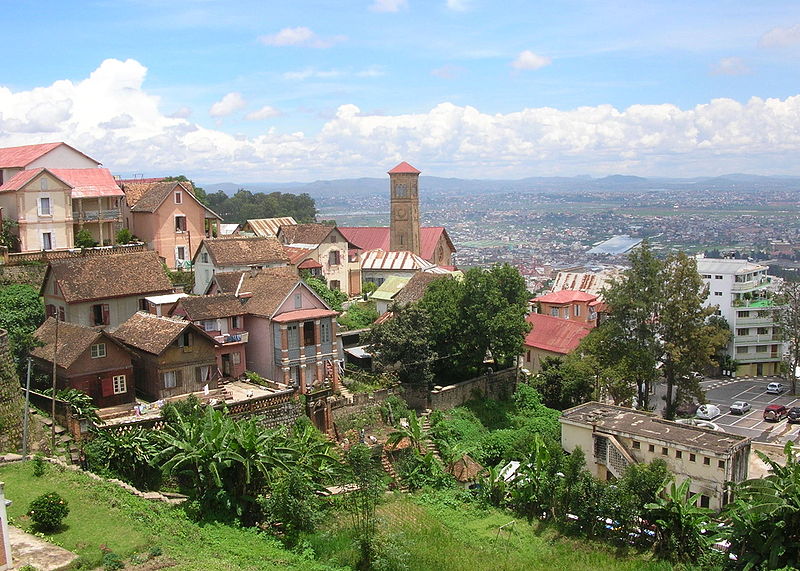
Looking down on Antananarivo, Madagascar. Source: Wikipedia
Situated on a mountain ridge, near the center of the island lengthwise and about 90 miles west of the eastern coast, Antananarivo is the capital of and the largest city in Madagascar. Founded in 1625, by the king of the Merina (an ethnic group from Madagascar), Antananarivo (formerly Tananarive) means “the city of the thousand”, taken from the number of soldiers assigned to guard it. In 1793, the city was made the capital of the Merina kingdom. About one hundred years later, Antananarivo was captured and colonized by the French. Madagascar finally gained independence from the French in 1960.
Today, Antananarivo is the economic and administrative center of Madagascar, with a population (in 2001) of 903,450 (1,403,449 in the metro). Exports include food, cigarettes, and textiles. Antananarivo is home to the University of Madagascar/Antananarivo, an Anglican cathedral and a Roman Catholic cathedral (as well as over 5,000 other church buildings), and Ivato International Airport (with service to Nairobi, Johannesburg, and Paris). Malagasy is the official language of Madagascar, though French is spoken there as well.
A few more facts about Antananarivo (from Wikipedia):
- Time zone: East African Time (UTC+3)
- Average elevation: 4,186 feet (1,276 meters)
- Climate zone: Temperate / subtropical highland
- Average high temperature: 75 °F (24 °C)
- Average low temperature: 57 °F (14 °C)
- Average annual high/low temperature range: 68 to 82 °F (20 to 28 °C) / 51 to 62 °F (10 to 17 °C)
- Record high temperature: 95 °F (35 °C)
- Record low temperature: 34 °F (1 °C)
- Average annual precipitation: 54 inches (1,365 mm)
Weather: At 18.5 °S, Antananarivo lies in the tropics of the Southern Hemisphere, thus the climate is warm and wet; however, the mountains keep the temperature milder than it would be otherwise. The coolest, driest months are from April to October.
Currently, every day this week is forecast to have a high near 82 and a low near 60. Scattered showers and thunderstorms are also forecast every day and night, with only a small amount of rain expected each day.
For weather maps and information on current and forecast Antananarivo weather, see Weather Underground and Weather Online UK.
For more information on Antananarivo, here’s a link to Wikipedia.
Next Tuesday we will take a look at the climate and weather in another part of the globe. As always, if you have any suggestions for future cities, please leave a comment!
Permalink
« Previous Page — « Previous entries « Previous Page · Next Page » Next entries » — Next Page »


