01.06.11
Posted in Uncategorized at 8:00 am by Rebekah

Photo by Jeff Makowski.
Recently I was asked to do a few interviews on storm chasing (see one article here), and I had a reporter ask me, prior to meeting, “I know a lot of storm chasing equipment is big and heavy, but would you be able to bring something in to demonstrate?”
I offered to bring in my laptop, but thought what kind of heavy-duty equipment is she expecting?
While the image many people have of storm chasers may consist of a vehicle decked out with a weather station, lightbars, and stickers, the amount of equipment that different chasers have may actually run from none to infinite.
Before the days of cell phones and computers, a chaser’s only piece of equipment was his eyes (well, besides a car and perhaps a map). Chasers had to know how to read the sky by looking for certain clues.
Today, many, if not most, chasers chase with at least a GPS and wireless data via cell phones and laptops. Many chasers also use cameras and video cameras to record the chase, and some like to place stickers, lightbars, hail guards, and/or weather equipment on the outside of their vehicle.
The only required equipment for storm chasing, though, is a knowledge of the weather and how storms work.
While “techno” storm chasing might keep us safer, by allowing us to see the storm on radar and stay away from that large hail, there is also somewhat of a danger with this method, if we become too dependent on our technology. Chasing is not as simple as getting in a car and going to the nearest radar blob that you see on your iPhone. Well, at least it usually isn’t. You must properly educate yourself before chasing, so you know what to look for when (not if) your technology fails you, and so that you know what to do to stay safe.
You’ll be a more successful, safer, and less stressed out chaser if you learn how the weather works, so you know how to read the sky for clues rather than only know how to read a radar display.
Tim Vasquez’ “Storm Chasing Handbook” is one of the best books out there on describing what goes into storm chasing. I thoroughly read it before going storm chasing, and I highly recommend it!
Permalink
01.05.11
Posted in Weather - Miscellaneous at 8:00 am by Rebekah

How do you judge whether one place is rainier than another? Is it by the average annual rainfall? The average annual number of days where rain is falling?
Let’s take a look at a few places in Washington, one of the wettest states in the country (data from the WRCC):
- Forks (northwest Olympic Peninsula) – average precipitation days: 202 days; average precipitation: 121.73 inches
- Seattle (eastern edge of the Puget Sound) – average precipitation days: 155 days; average precipitation: 37.07 inches
- Vancouver (southwest Washington) – average precipitation days: 150 days; average precipitation: 41.92 inches
Based on these statistics, I think we’d have no trouble agreeing that Forks is rainier than both Seattle and Vancouver.
However, what about Seattle versus Vancouver? Vancouver receives more precipitation, but Seattle averages a few more rainy days per year.
One idea is that perhaps Seattle’s rains are of a lighter variety. Maybe Seattle gets more drizzle and Vancouver gets more moderate to heavy rains (hmm…maybe the type of rain could be another factor in deciding which of two places is rainier).
What do you think?
Permalink
01.04.11
Posted in Non-US Weather, Weather News at 8:01 am by Rebekah
This week’s post in the global weather and climate series features Rockhampton, Australia. Rockhampton is currently undergoing one of Australia’s worst flood events on record.
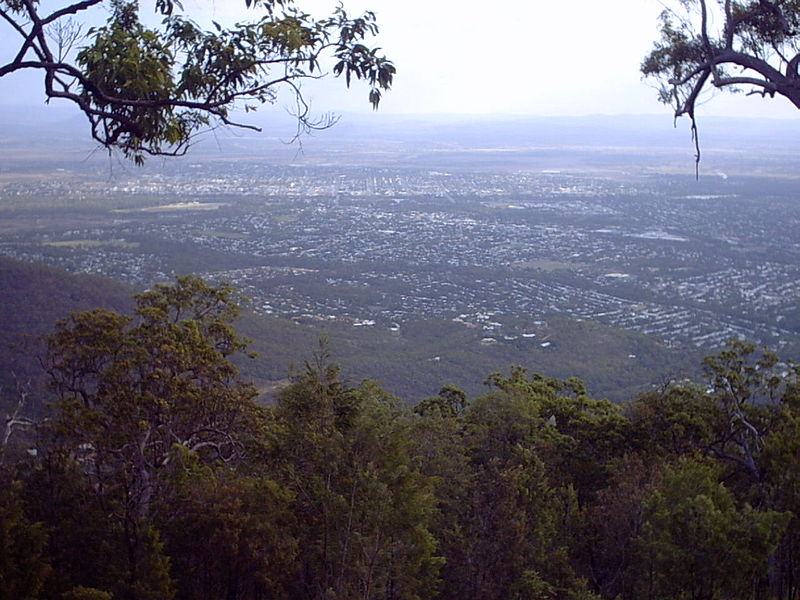
Rockhampton, from Mount Archer. Courtesy of Wikipedia.
Rockhampton is located in a hilly part of northeastern Australia, in the state of Queensland. Situated on the Fitzroy River, about 25 miles from the Coral Sea, Rockhampton lies just north of the Tropic of Capricorn.
Rockhampton was founded in the mid-1800s, as grazing lands and eventually gold attracted European settlers. Cattle continue to serve as a large part of the city’s economy, and Rockhampton promotes itself as the Beef Capital of Australia. The current population of the city is 76,729.

The Rockhampton Zoo features a Cassowary, naturally found only in New Guinea and far northeastern Queensland. A large, flightless bird, the Cassowary is smaller only than the ostrich and emu. Courtesy of Wikipedia.
A few more facts about Rockhampton (from Wikipedia):
- Time zone: Australian Eastern Standard Time (UTC+10)
- Average elevation: 37 feet (11.3 meters)
- Climate zone: Humid subtropical
- Average high temperature: 83 °F (28 °C)
- Average low temperature: 62 °F (17 °C)
- Average annual high/low temperature range: 74 to 90 °F (23 to 32 °C) / 49 to 72 °F (10 to 22 °C)
- Record high temperature: 114 °F (45 °C)
- Record low temperature: 30 °F (-1 °C)
- Average annual precipitation: 31 inches (799 mm)
Weather: Rockhampton is currently inundated, following copious amounts of rainfall during a tropical cyclone and various summer thunderstorms. The airport has been shut down (due to flooding) and only one escape route remains for the city. The water level in the Fitzroy River has reached 30 feet and is expected to go even higher by tomorrow, at which point the city should become completely isolated.
The area of Queensland that has been subject to the floods is greater than the size of Texas and greater than the size of France and Germany combined, with over 200,000 people being affected. Many people have had to leave their homes because the waters are too high. For more on the floods, see Sky News, BBC News, and MSNBC. Latest flood warning for the Fitzroy River.
Rockhampton experiences, on average, some 300 sunny days per year; however, there has been a trough of low-pressure situated over the Queensland coast for quite some time now, providing very rainy conditions. This setup is fairly common during La Niña years.
Unfortunately, as we are in a fairly strong La Niña, it does not look like Queensland will receive much relief from the rain any time soon. It may even take as long as a month before Queensland sees much relief from the rain and floodwaters.
For weather maps and information on current and forecast Rockhampton weather, see the Australian Bureau of Meteorology, Weatherzone, Weather Underground, and Weather Online UK.
For more information on Rockhampton, here’s a link to Wikipedia.
Next Tuesday I plan to take a look at the climate and weather in another part of the globe. As always, if you have any suggestions for future cities, please leave a comment!
Permalink
01.03.11
Posted in Weather Education at 8:00 am by Rebekah
Today I’d like to start a weather education series. While some of you may have a background in meteorology, others may be confused at times when I speak of instability and wind shear.
So, beginning with the basics and covering topics such as weather maps and severe weather forecasting, every Monday I will give a short lesson on meteorology. The blog posts will build upon each other, and eventually I will make a list of links to the posts and put it on my website.
————————————————–
What is meteorology?
Meteorology (also known as atmospheric science) is the study of the atmosphere and weather. Climatology is the study of climate.
What is the atmosphere?
The earth’s atmosphere is a thin layer of air extending from the earth’s surface to a height of about 12 km (7.5 miles).
Atmospheric composition:
- Nitrogen: ~78%
- Oxygen: ~21%
- Argon: ~0.93%
- Carbon dioxide: ~0.039%
- Water vapor: variable, from 0 to 4%
- Other trace gases, including ozone and methane
What is weather?
Weather is the state of the atmosphere at any given place and time. For example, the weather conditions at midnight New Year’s Eve 2010 in Seattle, Washington included a temperature of 27 °F, a relative humidity of 66%, calm winds, and clear skies.
Climate, in contrast, is the average weather at any given place over a long period of time. For example, the average high temperature in Seattle for the month of January, a component of the city’s climate, is 46 °F.
Why is there weather?
As described in last week’s post, “What If…We Could Prevent Storms From Occurring?“, the sun heats the earth unevenly (because of earth’s tilt). Some of this radiation is absorbed by the earth, which then emits longwave radiation back to space.
Long story short (check out that blog post for more detail), the tropics receive more radiation than they emit, and the poles emit more radiation than they receive. This means the tropics have a net surplus of radiation and the poles have a net deficit of radiation (see figure, below).
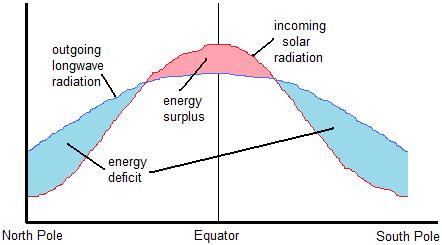
Earth’s Annual Radiation Budget
The earth is always trying to balance out inequalities, though, so warm air must get transported towards the poles, while cold air must get transported towards the tropics! This transfer of air is what drives our weather.
————————————————–
Come back next Monday to learn about the elements of weather, beginning with temperature and the layers of the atmosphere!
Permalink
01.02.11
Posted in Severe Weather Post-analysis, Weather News at 8:01 am by Rebekah
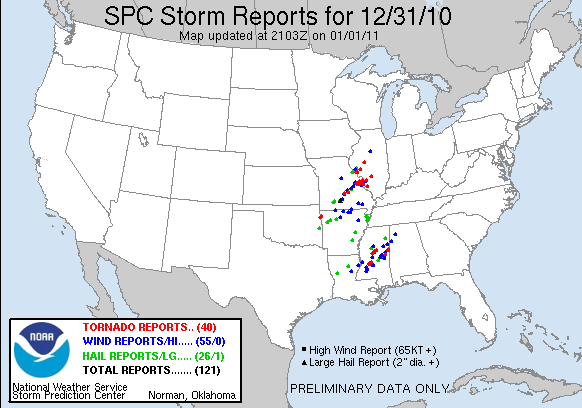
While 2010 had a slow start to the tornado season (see Where Have All The Tornadoes Gone?, Tornado Season So Far…, and Minnesota Leads U.S.; U.S. Back Near Average), it ended with a rare New Year’s Eve tornado outbreak.
40 tornadoes were reported between the morning of the 31st and the morning of the 1st. At least 7 people have died as a result of the twisters in Arkansas and Missouri.
Several of the tornadoes were rated EF3 on the Enhanced Fujita Scale, as lift from the big trough, warm, moist air ahead of an arctic cold front, and ample vertical wind shear provided the necessary conditions for strong tornadoes.
The last significant New Year’s Eve tornado outbreak occurred in 1947, when 20 people were killed and over 250 were injured.
So now that the year is over, how did 2010 stack up against the past few years in terms of tornadoes and tornado reports?
Tornado reports (2010 in red, ’05 to ’09 average in gray), from the Storm Prediction Center:
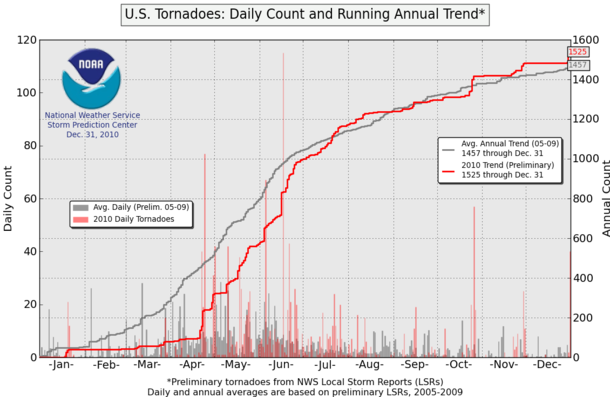
Note the year was below average until mid-July, at which point it fluctuated about the average and then ended just above average, with 1,525 tornado reports.
Tornado reports from ’05 through ’10, including the ’05 to ’09 average, in gray:
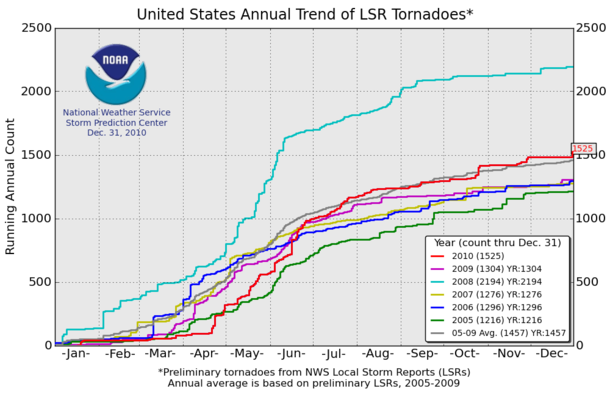
2010 was below the previous 5-year minimum until late April.
Adjusted tornado trend and percentiles (adjusted to account for over-reporting; for details on calculation, see SPC site):
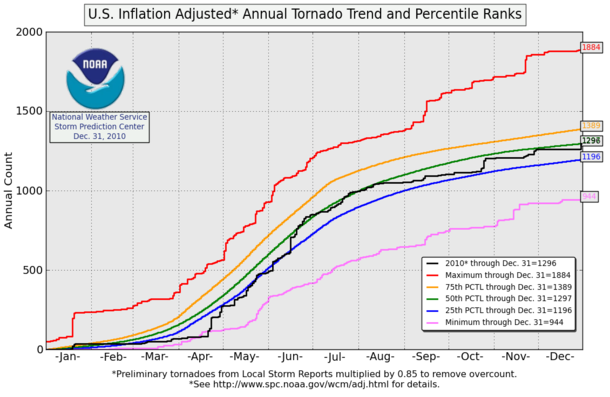
The estimated number of tornadoes in 2010 briefly dropped below the 1954 to 2007 minimum, before climbing up to just about the 50th percentile (the median). The year ended with an estimated 1,294 tornadoes.
For more detailed information on the New Year’s Eve 2010 tornado outbreak, check out the summaries/reports/photos from individual National Weather Service offices. Here are a few to get you started: Tulsa OK, St. Louis MO, Little Rock AR, and Jackson MS.
For more, go to the National Weather Service page and click on the area you are interested in.
Permalink
« Previous Page — « Previous entries « Previous Page · Next Page » Next entries » — Next Page »


