02.28.11
Meteorology 101: Surface Observations
Meteorologists use two main methods to forecast the weather: analysis of weather data and analysis of weather models. In order to know the state of the atmosphere as accurately as possible, and in order to have the best data to feed into the weather models, we must first take good weather measurements.
A discussion of weather measurements can be broken up into three categories: surface observations, upper-air observations, and remote sensing (e.g., radar and satellite). Today we will touch on surface observations.
Surface Observations
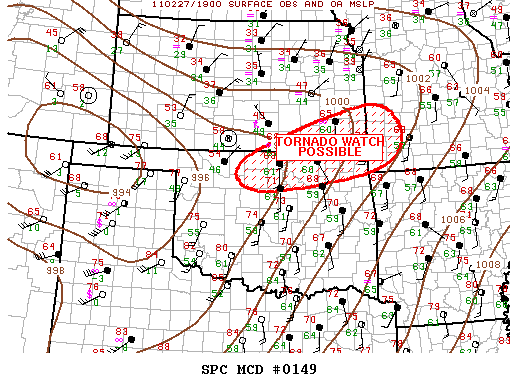
Most surface observations are taken hourly around the world, and include measurements of temperature, dewpoint, pressure, wind speed and direction, cloud cover, precipitation, and current weather (e.g., thunderstorms or fog).
Temperature
Temperature is measured with a thermometer, though not all thermometers today have to be mercury-filled. Temperature can also be measured with an electrical resistor called a thermistor (this is what may be used in your thermostat to help regulate your heater or air conditioner).
Temperature units are given in Fahrenheit (°F), Celsius (°C), or Kelvin (K).
Dewpoint
Dewpoint temperature can not be measured directly, but is calculated from measurements of either the wet-bulb temperature or the relative humidity. Instruments include psychrometers and hygrometers. A psychrometer has two thermometers, one of which has the tip covered by a wet piece of cloth. As the moisture on the cloth evaporates, the temperature on the “wet-bulb” thermometer drops (remember evaporation takes heat, leaving the environment cooler). The drier the air, the more the water evaporates, and the lower the wet-bulb (and dewpoint) temperature.
There are many different types of hygrometers, including electrical ones and ones made of hair. You know how your hair can get frizzy or limp depending on the air’s humidity? Hair hygrometers take advantage of this property, and make humidity measurements based on it.
Dewpoint units are also given in Fahrenheit (°F), Celsius (°C), or Kelvin (K).
Pressure
Pressure was traditionally measured in a mercury barometer. An empty glass tube, closed on the top, would be placed in an open container of mercury, forming a vacuum inside the tube. The higher the pressure, the more the air would push down on the mercury, forcing some of it up the tube.
Today, pressure units are still often given in inches of mercury (in. Hg), though we typically use other types of barometers. Meteorologists report pressure in units of millibars (mb) or hectoPascals (hPa).
Wind
Wind speed is measured with an anemometer. A cup anemometer has three small cups on a horizontal plane, and the faster the wind, the faster the cups spin around. A newer way of measuring both wind speed and direction is with a sonic anemometer. Sonic anemometers just look like a few sticks sticking up, and use sound waves to detect the direction and speed of the wind.
Wind speed units are commonly given in miles per hour (mph), nautical miles per hour (knots), kilometers per hour (km/h), or meters per second (m/s).
Clouds
The amount of cloud cover and the height of the clouds can be measured with a ceilometer. A ceilometer sends up a laser beam which reflects off of clouds. Another way to assess the clouds is to just look out the window. 🙂
Precipitation
Rainfall can be measured with different types of rain gauges. One of my favorite types is the tipping bucket rain gauge, which consists of two small buckets on a seesaw device. When one of the buckets is full, it tips over and empties itself while the other bucket fills up.
Measuring snowfall can be a bit trickier; sometimes snowfall measurements are recorded by someone with a ruler, but there are automated ways of measuring the snow. It’s also important to measure the liquid water equivalent of snow, which is the amount of liquid water if the snow is melted. Even a heavy snow can result in a low liquid water equivalent. A standard snow to water ratio is 10:1 (i.e., 10 inches of snow to 1 inch of water), though a dry snow could be 20:1 or even 40:1 and a very wet snow could be 5:1.
————————————————–
Next Monday we will talk about upper-air observations, including weather balloons.
Permalink Comments off
