02.11.11
Posted in Winter Weather at 8:00 am by Rebekah
Four years ago, a massive winter storm struck the midwestern and northeastern U.S. and southeastern Canada, peaking in intensity on Valentine’s Day.
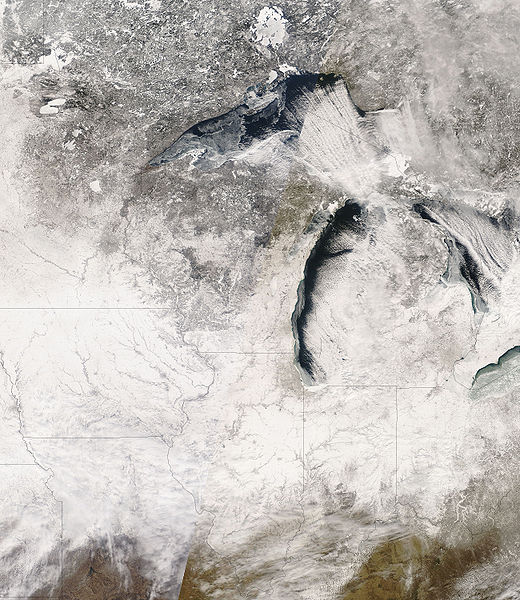
NASA image of snow cover over the Midwest
On February 10th, a low pressure system developed on the east side of the Rockies and began to move across the Great Plains. The low strengthened as it moved eastward, and reached the mid-Atlantic coast by the 14th, at which point it moved northward up the coast.
Cold, arctic air plunged southward in the wake of the low, as a high pressure system moved from Canada into the Northern Plains.
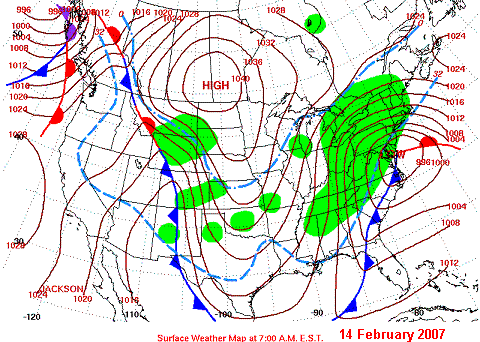
NWS surface weather map
Throughout the storm’s life, over 6 inches of snow fell in a swath from the Midwest to the Northeast and up into southeastern Canada. The Northeast also experienced blizzard conditions after the low passed and up to 2 feet of snow in places. Areas east of Lake Ontario and Lake Erie received some record amounts of lake-effect snow. Heavy sleet and freezing rain also fell from the lower Ohio Valley to the mid-Atlantic and New England. In the Southeast, severe thunderstorms and tornadoes were reported.
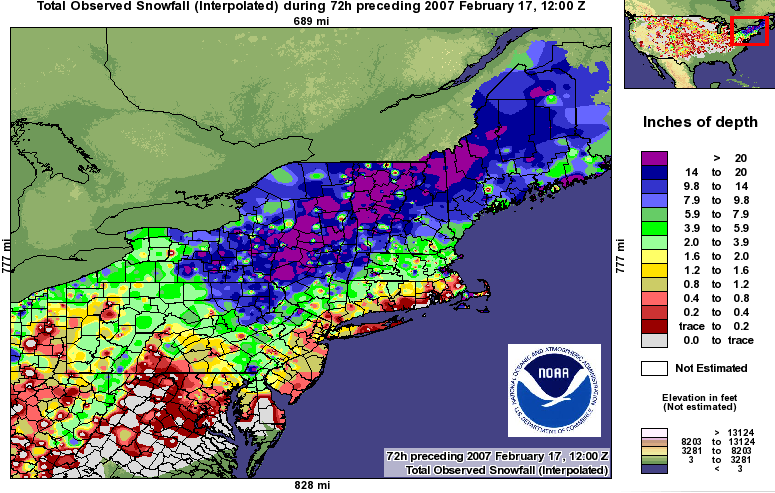
The National Weather Service claimed this winter storm was one of the three largest snow storms to affect the Northeast since 1940.
For more on the Valentine’s Day Storm, see Wikipedia, NWS State College, NWS Burlington, and NOAA News.
Permalink
02.10.11
Posted in Non-US Weather, Tropical Weather, Weather News at 4:14 pm by Rebekah
Parts of Australia have been flooding for the past couple of months now. With even more rainfall following Tropical Cyclone Yasi’s landfall last week, how is the country doing lately in terms of rainfall amounts and river heights?
February 3 – February 10 rainfall totals (Bureau of Meteorology)
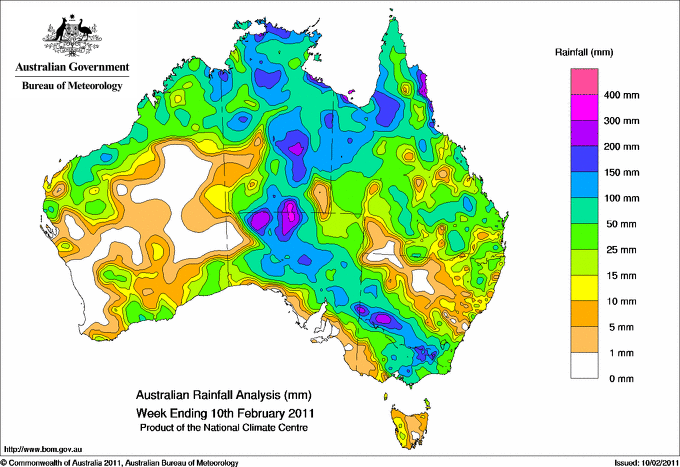
The biggest thing that pops out at me from this map is the swath of higher rainfall from northern Queensland southwestward to the south central part of the Northern Territory, as a result of Tropical Cyclone Yasi, as well as the swath of rain from north central South Australia southeastward through northern Victoria / southern New South Wales, as a result of a trough of low pressure.
Current river conditions (Bureau of Meteorology)
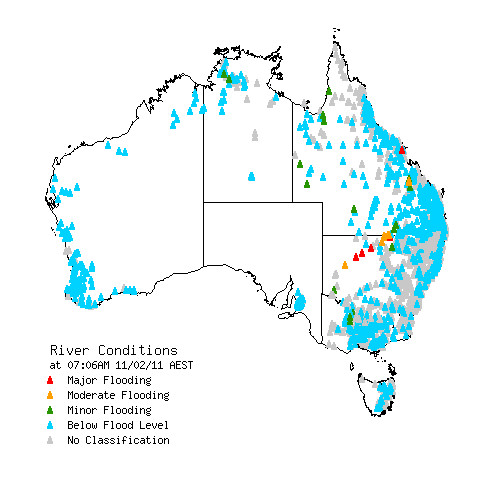
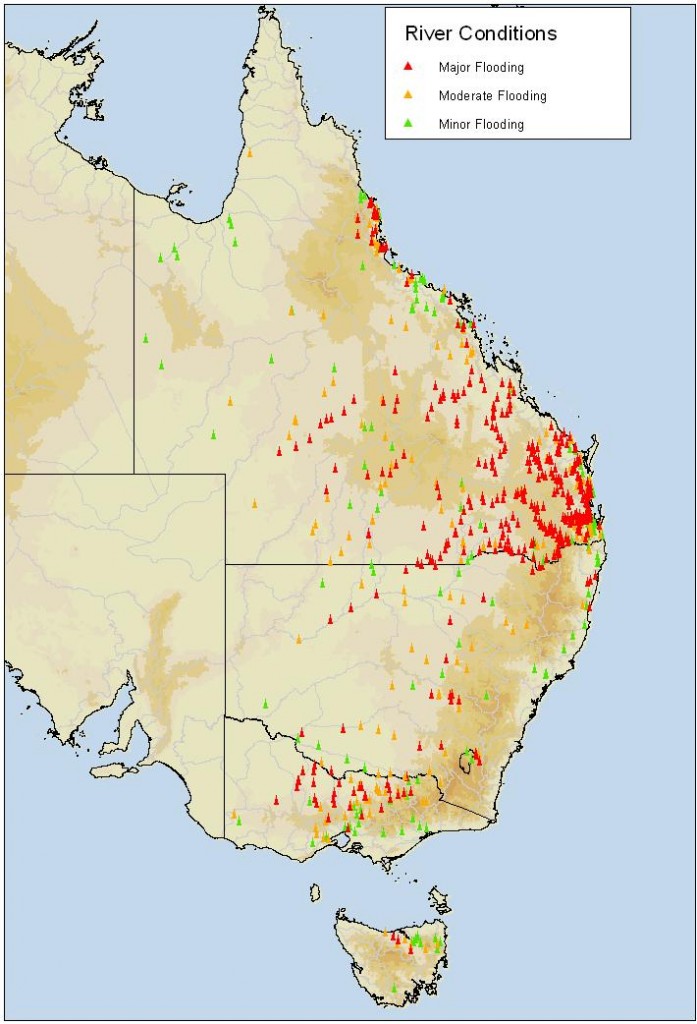
This map is better than those from a few weeks ago (see below); most of the rivers are below flood level now, with the exception of a few in Queensland and New South Wales.
November 26 – January 20 peak river conditions (Bureau of Meteorology)
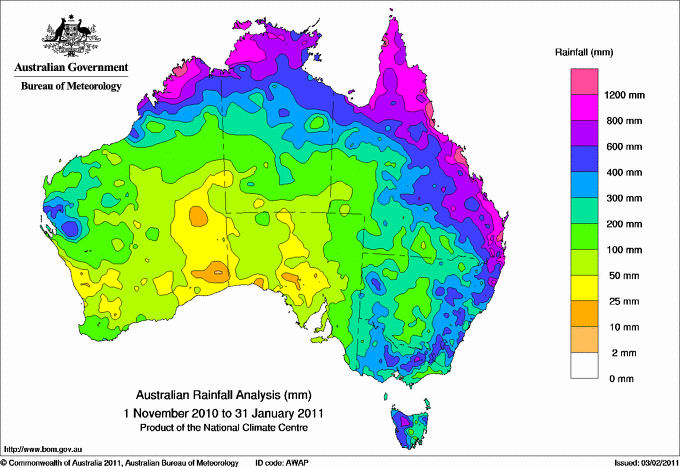
Now for a look at some rainfall maps from over the past three months…
November 1 – January 31 rainfall totals (Bureau of Meteorology)
November 1 – January 31 rainfall anomalies (Bureau of Meteorology)
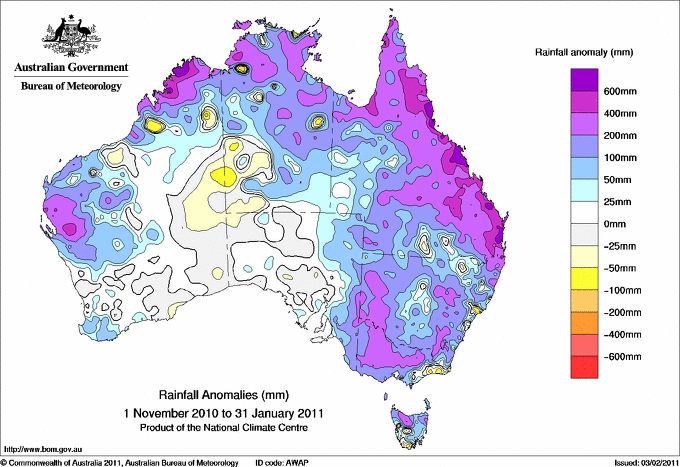
Wow, many coastal areas received well above average rainfall! Now how does this rainfall compare to the average rainfall?
November 1 – January 31 rainfall percentages (Bureau of Meteorology)
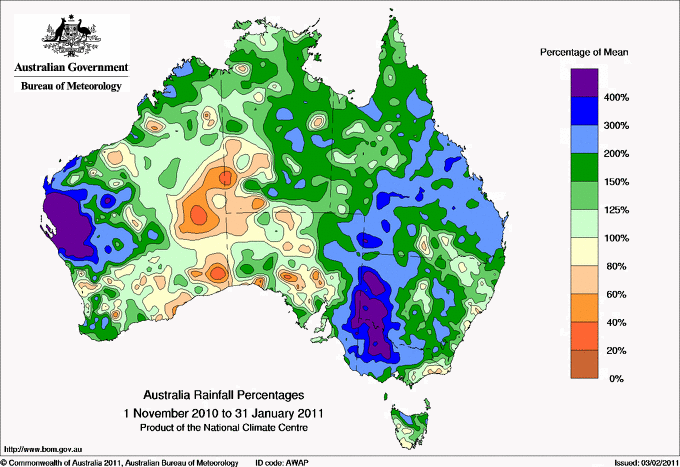
Okay, so most of eastern Australia experienced above average rainfall from November through January. More specifically, western New South Wales and Victoria had well above average rainfall, as well as the west central coast of Western Australia.
Now how does this compare to the records?
November 1 – January 31 rainfall deciles/records (Bureau of Meteorology)
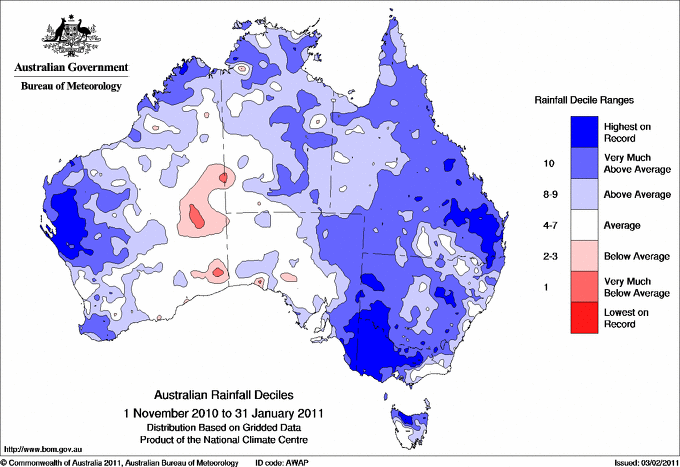
This map shows that the rainfall in most of eastern Australia was well above average…much of Victoria, western New South Wales, and southeastern Queensland broke all-time rainfall records. That’s a pretty large record-breaking area! Note also that the west central coast of Western Australia has also received the highest amount of rainfall on record.
Has the rain affected the temperatures much? Absolutely.
November 1 – January 31 mean temperature anomaly (Bureau of Meteorology)
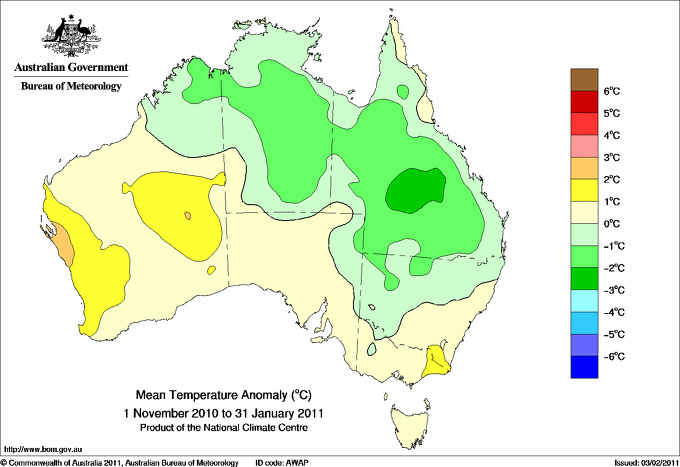
It’s not a coincidence that Queensland’s average temperatures were lower from November through January…the clouds and rain contributed quite a bit to the slightly cooler weather.
For more on Australia’s climate data, check out the following links from the Bureau of Meteorology: Queensland in January 2011: Widespread flooding continued; Special Climate Statement 24 [on frequent heavy rains in late 2010 / early 2011, PDF document]; and Severe Tropical Cyclone Yasi [maps and info]. To see more of the above maps, check out the links posted in the captions.
One more thing: models show another tropical cyclone could develop in the Gulf of Carpentaria next week (and make landfall) and another cyclone off the coast of Western Australia by next weekend (though it would move away).
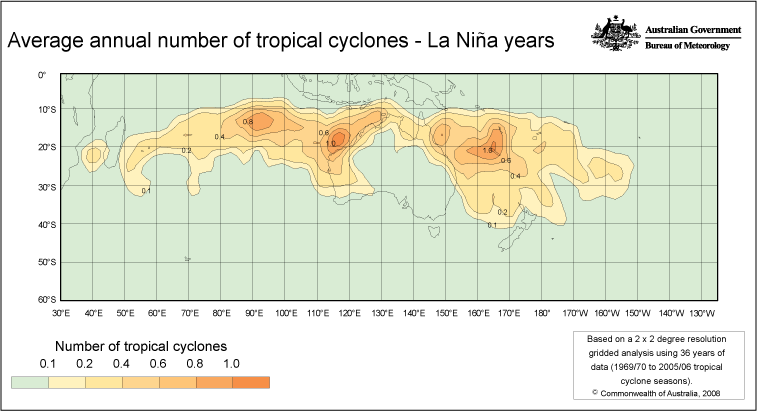
Here’s a map from the BoM showing the average annual number of tropical cyclones around Australia (click to enlarge):
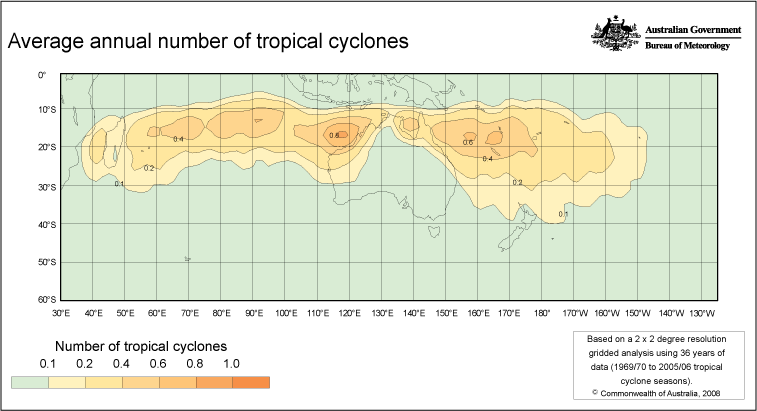
Compare that to a La Niña year, which we’re in now:
Stay tuned and stay safe!
Permalink
Posted in Weather News, Winter Weather at 12:16 pm by Rebekah
Daily record lows are broken all the time. But it isn’t every day that the all-time record low for an entire state is broken.
Early this morning the temperature dropped to –28 °F in Bartlesville, in northeast Oklahoma. That’s 28 BELOW ZERO. This broke the previous all-time record low for Oklahoma, -27 °F, set in 1905 and tied in 1930. Note: this value is “unofficial”, meaning it will have to go through review for it to become an official low.
The recent heavy snowfall in northern Oklahoma helped in this case, as temperatures will drop more when there is a heavier snowpack.
Based on the Oklahoma Mesonet, the temperature got even lower than this, though, as Nowata, Oklahoma (near Bartlesville) reached -31 °F this morning. However, as this was not a standard recording station set up by the NWS or FAA, the temperature will likely remain unofficial.
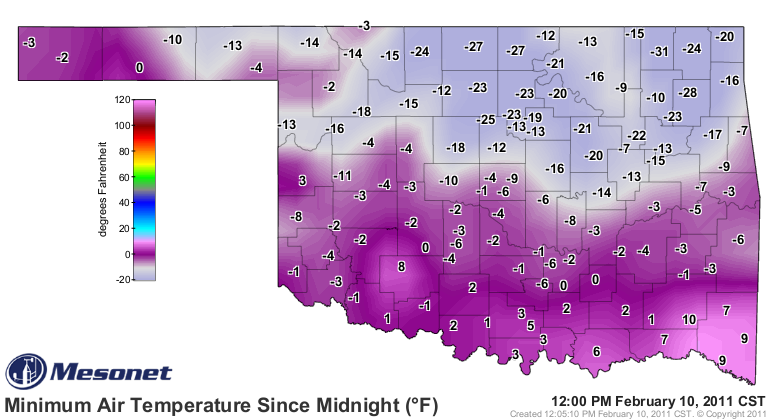
Oklahoma Mesonet, showing the lowest recorded temperatures since midnight.
Oklahoma City dropped to -5 °F, a new record low for February 10th for the city (plus Oklahoma City hadn’t dropped below zero since February 1996), and Tulsa dropped to -12 °F last night, tied for 5th lowest and the coldest since 1930.
Other record lows for the 10th include Springfield, Missouri (-10 °F), Wichita, Kansas (-17 °F), Amarillo, Texas (-6 °F), Dallas, Texas (15 °F), and Austin, Texas (19 °F).
Relief is on the way, though…temperatures could hit 70 °F here in central Oklahoma on Sunday! 🙂
Permalink
Posted in Uncategorized at 8:00 am by Rebekah
The long-range GFS model is hinting at a pattern change that could soon bring spring-like temperatures and higher dewpoints to the Southern Plains. The wishcasting GFS model (i.e., so long-range that it can change every run and is virtually meaningless) is hinting that I could be chasing storms in Texas by the end of the month.
With the storm season just around the corner, I’ve been in a mad rush to get everything ready. I finished my 2010 chase logs and posting of photos on the website (I may post some video clips later, but all the best video is on the DVD anyway). I am finally starting to finish up posting chase logs and photos from 2007 and prior years (March 28 is up now, including photos of a beautiful, long-lived Texas Panhandle tornado). I only have 9 more of these old chase logs to post, and I plan to finish up within the next couple of weeks. I’m planning on getting some more practice soon with settings on my DSLR and HD camcorder, so I can take better photos and videos this year. I’ve already looked into a couple of equipment upgrades for this year, including data cards and mobile phone antennae, but I may just go with the setup I’ve got.
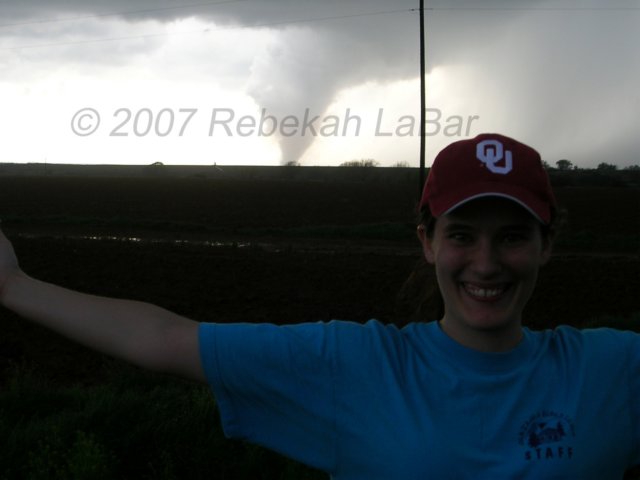
March 28, 2007, Briscoe County, Texas
In the meantime, I’ve also been busy with my paying job, which has had me programming in Perl and VBA. It’s actually been a lot of fun. I’ve got to finish up some research work on my lightning project by the end of the semester (mid-May), and then I’ll be on to the next chapter of my life. I don’t know just where I’ll be or what I’ll be doing come June, so I plan to chase every opportunity until then. This may be my last spring in which I can chase whenever and wherever my finances allow, so I hope to make the most of it!
I’ve heard a lot of different predictions on what this year could be like in terms of storms, but just like any year, it’s impossible to say if it’ll be a busy year or not and just where the hotspots might be. I’m hoping for more Southern Plains action, of course, with some good Texas Panhandle chases and hopefully a trip or two to southwest Kansas.
Stay safe everyone! Here comes spring!
Permalink
02.09.11
Posted in Winter Weather at 8:00 am by Rebekah
Last week the University of Oklahoma (OU) shut down for a whopping FOUR days in a row, which was unprecedented. Today, schools and universities are closed again, for the second significant snow storm within a week.
Question: how long will OU close this week? Depending on how much snow we get, schools may be closed again tomorrow and possibly even Friday. I’m not taking any classes and I can do most of my research work from home, so it doesn’t really matter to me…but some students have barely had any class since the semester started.
An article in the OU school newspaper on Monday quoted the Vice President and Provost as saying “The faculty is asked to make up that lost time in the remainder of the class period. They should cover the same material without scheduling additional classes.”
Here’s the article from the OU Daily: No make-up classes allowed after days off
I have had a few professors, all for OU graduate classes (not just in meteorology), who have scheduled make-up classes when they have to cancel class because of conferences or snow or something. Part of the problem is when not everyone can come…students should not be expected to know material that is taught outside of normal class hours (unless perhaps it’s something from the book, if there is a book). I have an idea that some of these professors will still be scheduling make-up classes, in spite of the Provost.
What do you think about that? Should professors be allowed to schedule make-up classes?
Permalink
« Previous Page — « Previous entries « Previous Page · Next Page » Next entries » — Next Page »


