02.08.11
Posted in General News at 12:50 pm by Rebekah
I finished posting the chase logs and photos for 2010…I haven’t posted any chase videos post-May 31, but for now you can see the best of my videos (with sound, unlike the YouTube clips) on my chase DVD, “The Whirlwind And The Storm“. 🙂
I’ve still got to get around to finishing up chase logs from 2005 – 2007, but there aren’t very many of them so it should go quickly once I start working on them again.
I’ll have a few website tweaks here and there by the time the chase season rolls around, and I’ll try to keep more up-to-date with 2011 chase logs and photos. Here’s to a successful 2011 storm chasing season!
Just got to get through another pesky snowstorm that could bring another 8+ inches of snow to central Oklahoma again tomorrow….
Permalink
Posted in Non-US Weather, Weather News at 8:00 am by Rebekah
This week’s post in the global weather and climate series features Vancouver, British Columbia, Canada.
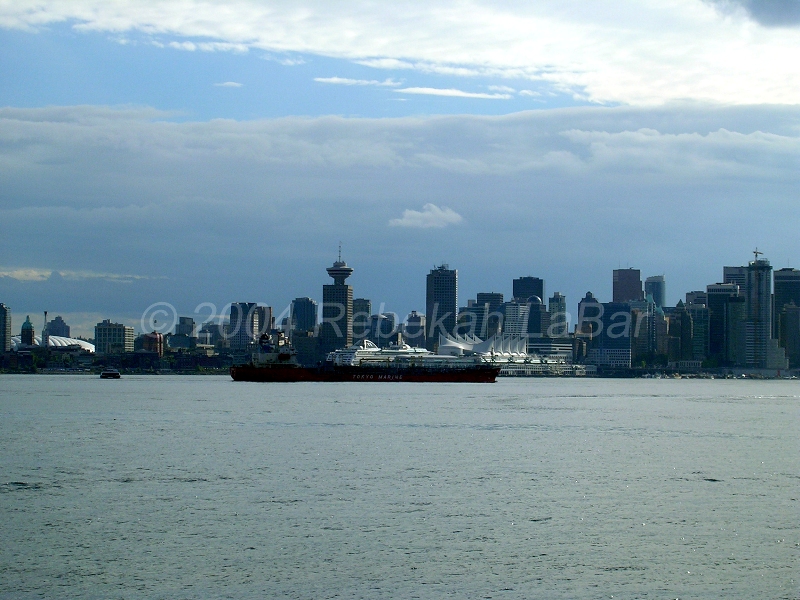
Vancouver, looking across the harbour from North Vancouver
Vancouver lies on the southwest coast of Canada, and with a metropolitan population (2006) of 2,116,581 (urban: 578,041), it is the most populous city in western Canada and the third largest in the country (in terms of the metro). Immigration has increased dramatically in recent years, and as many as 30% of the city’s population is of Chinese heritage (~52% of the city’s population does not speak English as their first language).
The primary industry of Vancouver is logging; in fact, the city began in the mid-1800s as a logging town. The port of Vancouver (Port Metro Vancouver) is also a vital part of the city, and is the fourth largest port (by tonnage) in North America, after South Louisiana, Houston, and New York/Newark. The second largest industry in Vancouver is tourism. Vancouver is also the third largest film-production center in North America, after Los Angeles and New York City. You may recognize the skyline of Vancouver in some TV shows and movies.
A few more facts about Vancouver (from Wikipedia):
- Time zone: Pacific Standard Time (UTC-8) or Pacific Daylight Time (UTC-7)
- Average elevation: 7 ft (2 m)
- Climate zone: Oceanic or marine west coast
- Average high temperature: 57 °F (14 °C)
- Average low temperature: 44 °F (7 °C)
- Average annual high/low temperature range: 43 to 71 °F (6 to 22 °C) / 33 to 56 °F (1 to 13 °C)
- Record high temperature: 94 °F (34 °C)
- Record low temperature: 0 °F (-18 °C)
- Average annual precipitation: 47 inches (1,199 mm)
- Average annual rainfall: 45 inches (1,155 mm)
- Average annual snowfall: 19 inches (48 cm)
Weather: In contrast to last year during the 2010 Winter Olympics, Vancouver has been seeing near average temperatures lately. January did bring above average rainfall, though, and that has been due in large part to an occasional stream of moisture from the central Pacific known as the Pineapple Express. The ridge in place over the eastern Pacific has been great for pulling the moisture northward into southwest Canada and the northwest U.S.
This mild, wet pattern is likely to continue for at least the next week or so.
As far as snow, here’s a snow depth map for British Columbia from The Weather Network:
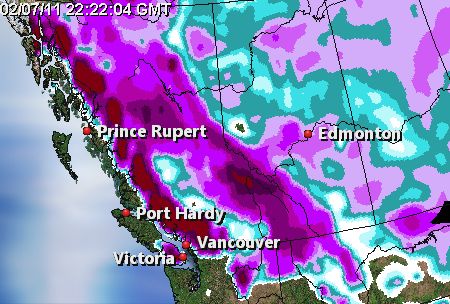

For weather maps and information on current and forecast Vancouver weather, see Environment Canada, Weather Underground, and The Weather Network.
For more information on Vancouver, here’s a link to Wikipedia.
Next Tuesday I plan to take a look at the climate and weather in another part of the globe. As always, if you have any suggestions for future cities, please leave a comment!
Permalink
02.07.11
Posted in Weather Education at 8:00 am by Rebekah
Today’s post in the weather education series is on clouds, one of the seven elements of weather (temperature, pressure, wind, moisture, clouds, precipitation, and visibility).
————————————————–
Saturation
Last week we looked at moisture, including the different phases, transformations, and methods of measurement (e.g., dewpoint and relative humidity). Now, what happens when the relative humidity hits 100%?
When the air’s temperature equals the dewpoint, the relative humidity is 100% and we say the air is “saturated“. Air can only “hold” so much water vapor, and when it maxes out, some of the water vapor must condense into liquid water droplets or deposit ice crystals. This means saturation can result in dew, frost, fog, or clouds.
How can we attain saturation? The amount of water vapor the air can hold depends on the temperature. Warm air requires more moisture to reach saturation than cold air, so we can reach saturation by either adding more moisture or lowering the air temperature.
Cloud Formation
Clouds are composed of liquid water droplets or ice crystals. Water vapor doesn’t necessarily condense into pure liquid water droplets, though, but condenses onto tiny particles of dust, smoke, salt, etc., called cloud condensation nuclei (ice crystals form on ice nuclei).
Also, it is important to note that liquid water droplets may exist below 0 °C…these are called supercooled water droplets, and they can exist in liquid form at temperatures as low as -40 °C/F. Supercooled water droplets are important in many ways that we will see later (e.g., freezing rain, hail formation, thunderstorms, etc.).
Cloud Classification
Clouds are classified with Latin words based on their height and appearance…for example, high clouds have a “cirro-” prefix, clouds a bit further down in the atmosphere have an “alto-” prefix, clouds that are flattish have “strato-” or “stratus” in their name, clouds that are bubbly have “cumulo-” or “cumulus” in their name, and clouds from which precipitation is falling have “nimbo-” or “-nimbus” in their name.
- High clouds: cirrus, cirrostratus, cirrocumulus…usually reside above 6 km, mostly made up of ice crystals, thin and often very white, responsible for many optical effects such as sundogs and halos
- Middle clouds: altostratus, altocumulus…usually between 2 and 6 km, mostly made up of liquid water droplets, usually more gray in color, sun’s disk may be visible through them, but no halo
- Low clouds: stratus, stratocumulus, nimbostratus…usually below 2 km, mostly made up of liquid water droplets, the sun typically cannot be seen through these clouds
- Deep clouds: cumulus, cumulonimbus…clouds with more vertical development, including thunderstorm clouds (cumulonimbus)
There are also many other clouds names that may be affixed to one or another of the above cloud names, including “congestus” (deep cumulus clouds that haven’t quite made it to the cumulonimbus stage yet), “lenticularis” (lens-shaped clouds that are common above or just over mountain tops), and “mammatus” (pouch-shaped clouds common under thunderstorm anvils).
For photo examples of these clouds types, here are a couple of website suggestions to get you started: Weatherscapes Cloud Photo Gallery and Blue Hill Observatory Cloud Photo Gallery.
————————————————–
Come back next Monday as we talk about precipitation, the next element of weather.
Permalink
02.06.11
Posted in Uncategorized at 8:00 am by Rebekah
My prediction for the Super Bowl today: Packers 24, Steelers 20. Go Pack Go. 🙂
With all the snow, ice, and cold weather affecting travelers going to the Super Bowl, I thought I’d see what I could find on NFL games (not just Super Bowls) that were played in extreme weather conditions.
First, a few stats about the Super Bowl (not including today), based on meteorologist Brian Neudorff’s weather blog:
- 17 of 44 bowls played indoors
- 16 of 44 bowls had a trace or more of rain nearby
- 2 bowls had snow on game day (1982, 2006)
- 1 bowl played during an ice storm (2000)
- Warmest high temperature: 82 °F (1973, 2003)
- Coldest high temperature for dome game: 16 °F (1982)
- Coldest high temperature for non-dome game: 49 °F (1985)
- Wettest Super Bowl: 0.92 inches (2007)
- Outside games with high wind gusts (1980, 1984, 1989, 2007)
And here is the NFL’s list of the “Top 10 weather games in NFL history” (the page has videos clips as well):
- Ice Bowl: Vince Lombardi’s Packers over Tom Landry’s Cowboys at Green Bay, in the 1967 NFL Championship Game (preceding Super Bowl II)…the temperature got to -15 °F and the wind chill to -48 °F (-36 °F under the 2001 scale), in the coldest NFL game (though not in terms of wind chill…see the Freezer Bowl)
- Tuck Rule Game: (Sometimes known as the “Snow Bowl” by Patriots’ fans) Patriots over the Raiders in the 2001 AFC Divisional Playoff Game…a controversial call came near the end of a game played during a heavy snow storm in Foxborough
- Fog Bowl: Bears over the Eagles during a surreal, heavy fog in Chicago, in the 1988 NFC Divisional Playoff Game
- Freezer Bowl: Bengals over the Chargers in Cincinnati, in the 1981 AFC Championship Game…the wind chill was -59 °F (- 37 °F under the 2001 scale) and the temperature was -9 °F…this was the first time the Bengals got to go to the Super Bowl
- 1975 AFC Championship Game: Steelers over the Raiders in Pittsburgh, with 20 mph winds, snow flurries, and a temperature of 16 °F
- 1948 NFL Championship Game: Eagles over the Chicago Cardinals in Philadelphia, with near blizzard conditions…the game’s only points came from Steve Van Buren’s touchdown in the 4th quarter, to give the Eagles their first title
- Snow Plow Game: Patriots over the Dolphins in a 1982 AFC East game in Foxborough…during a heavy snow storm, late in the 4th quarter, a small snow plow was used to clear a line from which a 33-yard field goal would be kicked…the snow plow unexpectedly veered left, clearing a good spot for the John Smith’s kick, which provided the only score in the game
- Sneakers Game: Giants over the Bears in New York, in the 1934 NFL Championship Game…freezing rain the night before made it difficult for players to run around on the field; one of the Giants’ players suggested changing to sneakers…in the 3rd quarter, with the Bears leading, the Giants switched their cleats for sneakers, and then went on to win the game
- 1979 Buccaneers vs. Chiefs Monsoon: Buccaneers over the Chiefs, 3-0, in Tampa Bay’s final home game of the 1979 season (and their first winning season)…torrential rain waterlogged the field, in one of the wettest NFL games
- Red Right 88: Raiders over the Browns in the 1980 AFC Divisional Playoff Game in Cleveland…the temperature was 4 °F, the wind chill was -36 °F, and the field was muddy…the game’s finish left a painful, if not memorable impression on Browns’ fans
Happy Super Bowl Sunday!
Permalink
02.05.11
Posted in Non-US Weather, Weather News at 8:00 am by Rebekah
Have you ever heard of the Pineapple Express?
The Pineapple Express is a term for a plume of moisture that originates around the east central Pacific (often near Hawaii) and travels up to the West Coast of the United States. This band of moisture is often responsible for heavy rain, snow, and/or flooding events from the Pacific Northwest to southern California.
Now, have you ever heard of the Rum Runner?
The Rum Runner is a similar moisture plume that runs from the eastern Caribbean up to western Europe. This atmospheric river of moisture is also responsible for many of the heavier rain and flooding events from Ireland and the United Kingdom to Spain.
Examples
The following map (click to enlarge), from Jason Cordeira’s website, shows global 250 mb heights (the “dips” in the northern hemisphere are troughs of low pressure, while the “mountains” are ridges of high pressure…the reverse is true for the southern hemisphere) and precipitable water (the amount of water that would be measured if all the moisture in the atmosphere at that point fell out as rain). The important part to note here is that the colors are showing moisture, and the bigger the number, the greater the moisture.
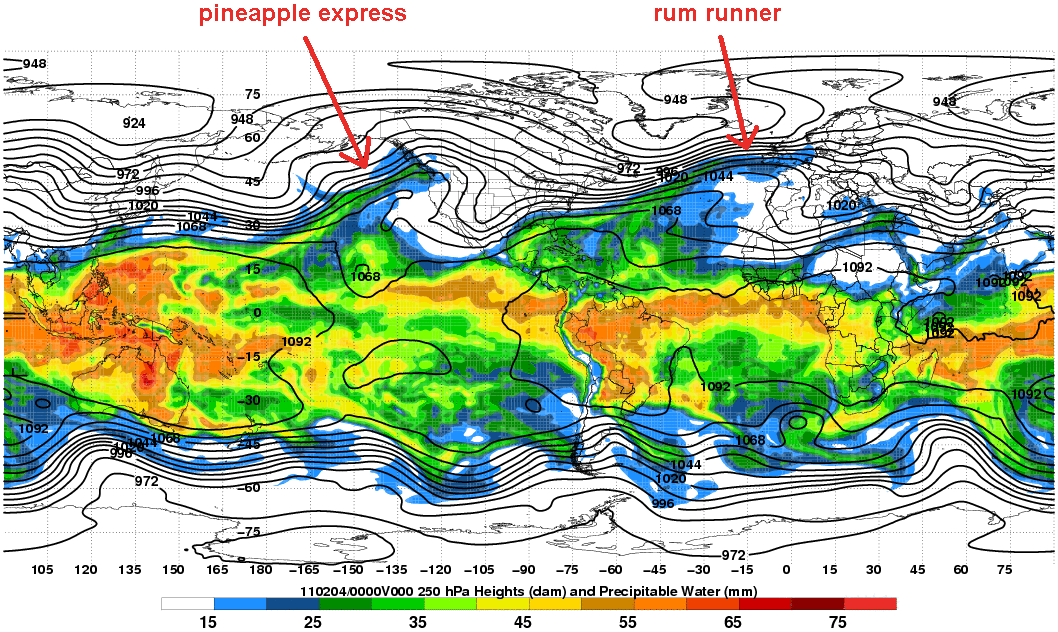
Note the plume of moisture being transported from the central Pacific up into British Columbia and Washington State…this is the Pineapple Express.
Note also the plume of moisture being transported from the western Atlantic up into Ireland and United Kingdom…this is the Rum Runner.
The infrared satellite image below, from the U.K. Met Office website, also shows evidence of the Rum Runner in the thin band of clouds that stretch across the image into southern Scandinavia.
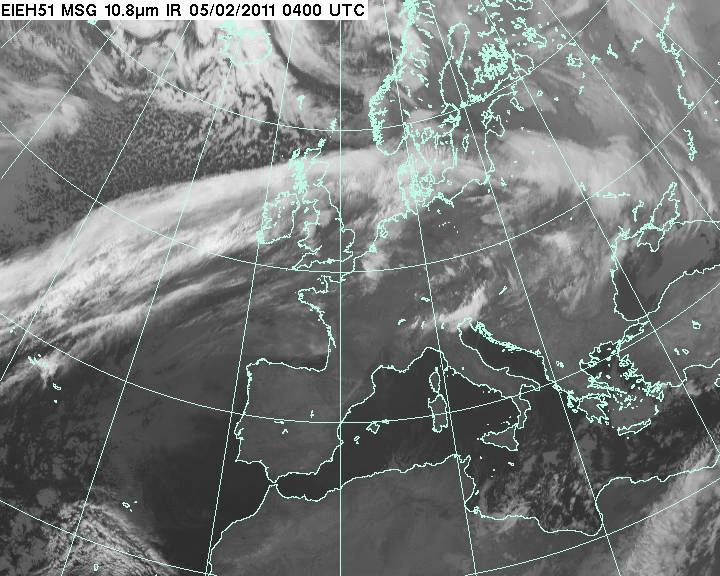
The Rum Runner is stronger when there is a strong westerly jet stream, as there is now. The stronger jet stream is a result of a stronger Icelandic Low and Azores High (for more on the North Atlantic Oscillation, see this blog post and this Wikipedia).
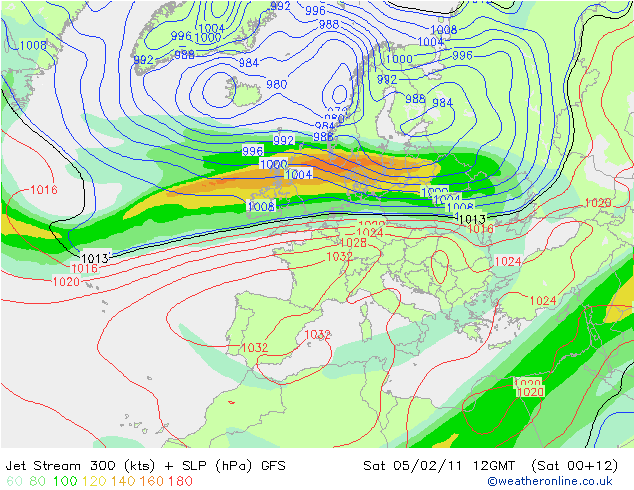
The above map shows surface pressure (contoured) and the 300-mb jet stream (filled colors), from Weather Online UK, for 12Z this morning. Note the low pressure over northern Europe and the high pressure over Spain, contributing to the higher wind speeds in the jet stream. This jet stream is transporting the deep plume of moisture into northern Europe (see also below, including precipitation).
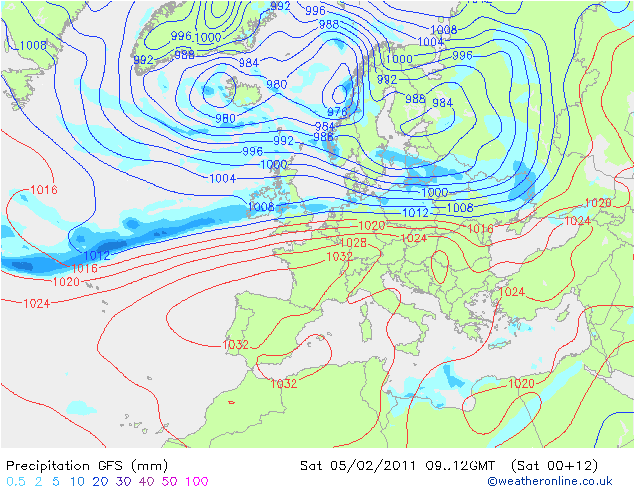
I recommend checking out the animation of the above precipitable water map, to get a better appreciation for how these atmospheric rivers move. It’s pretty cool, and can be found at the website of Jason Cordeira, student at SUNY Albany.
Permalink
« Previous Page — « Previous entries « Previous Page · Next Page » Next entries » — Next Page »


