03.21.11
Posted in Weather Education at 8:00 am by Rebekah
Last week in the weather education series we looked at weather radars; this week we’re going to take a look at weather satellites.
Types of Satellites
There are two major types of satellites: polar and geostationary.
Polar satellites orbit the earth from pole to pole. This allows the satellite to take images of pretty much the entire earth.
Geostationary satellites orbit the earth around the equator, but they are so far out in space (about 36,000 km, or 22,500 miles) that they practically remain stationary above a certain spot on earth.
Most of the U.S. weather satellite images you see are from the GOES series (Geostationary Operational Environmental Satellite), from either GOES-11 (GOES West, at 135°W over the Pacific Ocean) or GOES-13 (GOES East, at 105°W approximately over the Rockies). GOES-12 (GOES South, formerly GOES East at 75°W over the Amazon River, off the East Coast) was placed into standby in April 2010.
Europe and Africa is imaged by the European Meteosat series, operated by EUMETSAT.
The western Pacific, including Australia and eastern Asia, is imaged by the Japan Meteorological Agency’s MTSAT.
Weather Satellite Channels
There are three primary bands: visible, infrared, and water vapor.
- Visible (0.4 – 0.7 µm) – this band is in the visible range, so this is what the earth would look like if you were in space. It is based on reflected sunlight, so these images are only available during the day. Visible satellite images show cloud tops, and the thicker the clouds, the whiter they appear on the satellite image.
- Infrared (11 – 12 µm) – this band is in the infrared (longer wavelength) range, so this is in effect sensing heat. From an infrared satellite image, we can deduce the cloud-top temperature. Infrared satellite images are lower-resolution than visible satellite images, but they are available night and day (since they don’t depend on the visible range). The higher the cloud tops, the whiter they appear on a visible satellite image.
- Water vapor (6.7 µm) – this band detects water vapor in the mid-levels of the atmosphere. This can be helpful for determining winds/troughs/ridges/etc. in the mid-levels. It is important to note that just because you see a stripe across a water vapor image, doesn’t mean there are any clouds there (it could just be moisture in the air). These images also are available night and day. Color schemes depend on the website you’re looking at; if it is a black and white image, the whiter the region, the more the moisture. Water vapor images are often colored, and typically higher moisture content will be shown in purples and/or greens, with drier air shown in reds and/or oranges.
Check out a few satellite sites for examples!
NOAA GOES
College of DuPage (has regional satellite images and my favorite for hi-res visible images)
EUMETSAT (Europe, Africa)
————————————————–
Next Monday we will talk about lightning detection systems.
Visible (0.4 – 0.7 µm) – this band is in the visible range, so this is what the earth would look like if you were in space. It is based on reflected sunlight, so these images are only available during the day. The thicker the clouds, the whiter they appear on a visible satellite image.
Permalink
03.20.11
Posted in Weather News at 8:00 am by Rebekah
Happy first day of spring!
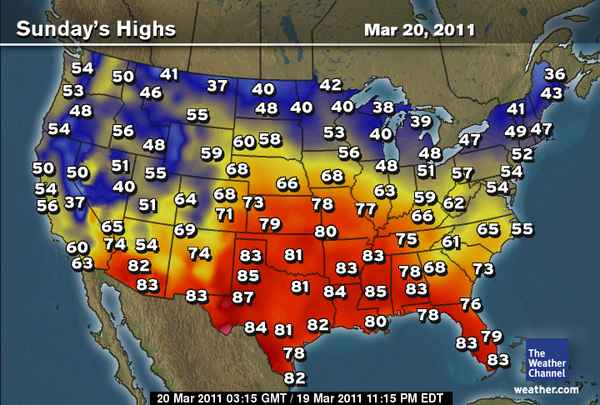
Here’s a look at today’s forecast highs from The Weather Channel.
Temperatures will be well above average from the Mississippi Valley into the Plains, but near or below average for the West Coast and the Northeast.
Permalink
03.19.11
Posted in Severe Weather Post-analysis, Weather News at 8:00 am by Rebekah
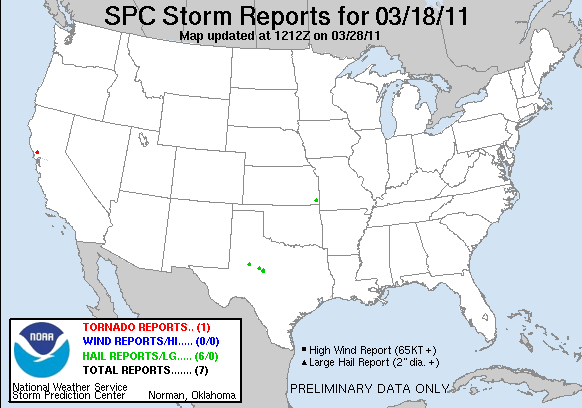
Yesterday morning a tornado or two touched down not far north of the San Francisco Bay.
The one storm report showing up right now on the Storm Prediction Center site is for a tornado at 1615Z (9:15 am Pacific Time) in Santa Rosa, California. The report said “EF1 tornado completely destroyed metal building and severely bent metal gate.”
I also heard that there may have been another tornado yesterday over the water, making it a waterspout.
While there were a few tornado-warned supercells around the Bay Area, the primary severe weather threat in the area was for high winds.
Permalink
03.18.11
Posted in Weather - Miscellaneous at 8:00 am by Rebekah
My specific research topic in meteorology is storm electrification and lightning. Lightning both fascinates and scares me. So when I was checking out The Weather Channel’s web page last night, a certain article caught my eye: “Lightning-Prone States“.
I knew that Florida was the lightning capital of the U.S., but what other states are on the list?
Here are the top five lightning-prone states, based on the average annual number (from 1996 – 2008) of cloud-to-ground lightning flashes per square mile.
- Florida – 25.3 strikes per square mile
- Louisiana – 20.3 strikes per square mile
- Mississippi – 18.0 strikes per square mile
- Alabama – 15.9 strikes per square mile
- South Carolina / Oklahoma – 14.6 strikes per square mile
There are really no surprises there; they’re all in the Southeast, with the exception of Oklahoma, which gets plenty of Southern Plains thunderstorm action in Tornado Alley.
What about the bottom of the lower 48?
My home state of Washington wins that award, with just 0.3 lightning strikes per square mile. (And THAT, folks, is the single biggest reason I decided to go to the University of Oklahoma for graduate school; I wanted to see more frequent, powerful thunderstorms in person.) The article from The Weather Channel also says that Washington gets only 1% to 2% of the number of lightning strikes per year that Florida gets. Furthermore, since 1959, Washington has had the lowest number of fatalities (five) due to lightning.
The other four states in the bottom five are Oregon, Idaho, Nevada, and California.
The U.S. on average see 25 million lightning strikes per year, with a 30-year (1980 – 2009) average of 57 fatalities attributed to lightning each year (tied with tornadoes and second only to flooding). Here’s a National Weather Service page with statistics on the 10-year and 30-year average annual number of weather-related deaths.
Speaking of lightning, it was unseasonably warm here yesterday and later today we’re expecting a cold front that could assist in the development of some thunderstorms (and there could be more early next week). Bring on the rain!
Permalink
03.17.11
Posted in Weather News at 8:00 am by Rebekah
Happy St. Patrick’s Day!
Here’s the 6 to 10 day Climate Prediction Center temperature outlook, valid for Tuesday through Saturday of next week:
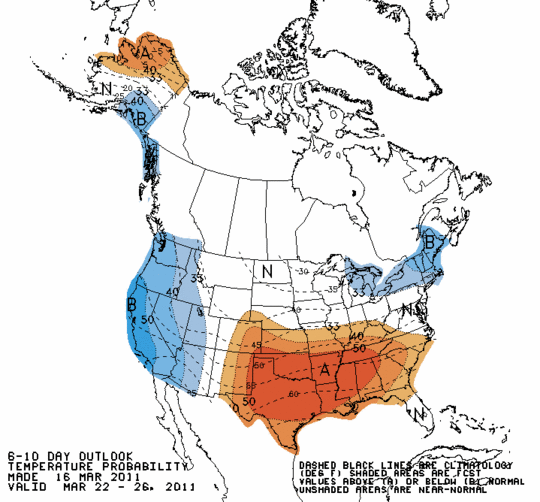
Note that below normal temperatures are still expected for the western U.S. as well as the far Northeast, while above normal temperatures are expected for the south central to southeastern U.S.
Now take a look at the precipitation outlook for the same period:
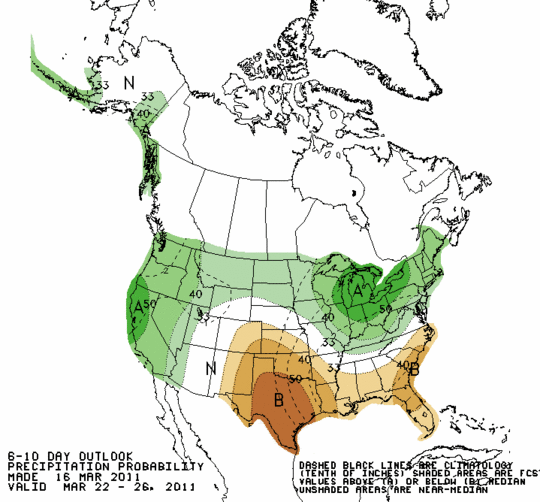
Above normal precipitation areas include the western and northern U.S., especially northern California and the Great Lakes region. Below normal precipitation is expected to continue in the south central and southeastern U.S.
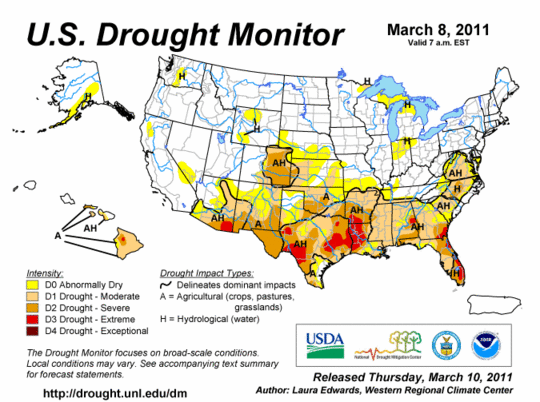
Unfortunately, there is no relief in the near future for areas that need rain and those that don’t. Last week’s drought monitor (there should be a new one coming out today) showed the drought in the southern U.S.
Earlier this week we got a few sprinkles in central Oklahoma, which went on to form a decent line of showers in southeastern Oklahoma. The sound of rain seemed so foreign to me that I wasn’t sure at first what I was hearing out my window. 🙂
A number of the southern states could sure use some more rain soon.
It does appear that there may be some hope of thunderstorms in the southern into the central Plains early next week, but it’s a little too early to be sure right now as the western trough seems to move a little slower with each model run.
Permalink
« Previous Page — « Previous entries « Previous Page · Next Page » Next entries » — Next Page »


