03.16.11
Posted in Climate Change, Non-US Weather at 8:00 am by Rebekah
Last week I went to an interesting seminar in the National Weather Center, given by Dr. David Karoly of the University of Melbourne, titled “The recent extreme weather in eastern Australia: A sign of climate change or the response to La Niña?”
Dr. Karoly is from Australia, but spent several years as a meteorology professor at the University of Oklahoma. His specialty is climate, more specifically climate change, and he is on the Intergovernmental Panel on Climate Change (thus he shared in the Nobel Peace Prize awarded to the IPCC and former Vice President Al Gore in 2007). On a side note, when Dr. Karoly and his wife moved back to Melbourne a few years ago, they gave me their cat, Ginger, the one I still have today.
Anyway, today I thought I’d summarize and share some of the main points from the seminar.
—————————————
Extreme Weather Events in 2010/2011
- Heavy rain events in Queensland, Victoria, Northern Territory
- Flooding in eastern Australia
- Category 5 Tropical Cyclone Yasi hit the northeast Queensland coast
- Heat waves / bushfires in southwest Western Australia
- Heat waves / bushfires in Sydney in January
Toowoomba and Lockyer Valley Flash Floods, 10 – 12 January
- 30 people killed in floods following heavy rains on 10 January
- 1 day rainfall of 298 mm (11.7 inches) on 10 January in Peachester, Queensland
- 3 day (10 to 12 January) rainfall of 617 mm (24.3 inches) in Peachester
- Not the heaviest rainfall, though; 25 to 27 January 1974 had a 3 day total of over 1000 mm (39 inches)
Brisbane Floods, 13 January
- No loss of life
- Followed very heavy rain in the Brisbane River catchment from 10 to 12 January
- River flood peak of 4.46 m (14.6 ft)
- January 1974 flood peak was 5.6 m (18.4 ft), following 1 day rainfall of 600 mm (23.6 inches), 3 day rainfall of 314 mm (12.4 inches)
- This year, “only” 166 mm (6.5 inches) in one day in Brisbane, so most of the flooding was from rain/flooding upstream
Victorian Floods, 12 – 14 January
- Rain and flooding
- Very moist, tropical air arrived with a trough
- Record high precipitable water, 64.8 mm (2.6 inches), observed with the 11Z sounding in Melbourne on 13 January…in 40 years of observations, this was 20% higher than the previous sounding record
Summer Rainfall, 2010 – 2011
- Record summer rainfall in Victoria, 30% higher than the previous record
- Highest summer rainfall in Queensland, but it was still much higher in the summer of 1973 – 1974
Record Rain in Darwin, Northern Territory 15 – 17 February
- Less unusual to have heavy rain in Darwin, but slow-moving Tropical Cyclone Carlos was unusual
- 1 day rainfall record of 368 mm (14.5 inches) on 16 February in Darwin
Category 5 Tropical Cyclone Yasi
- 1 death attributed to Yasi, as a result of fumes from a diesel generator
- Very well forecast tropical cyclone
- Landfall around midnight on 3 February, near Innisfail and Cardwell, Queensland
- Weather station at Clump Point observed a minimum pressure of 929 mb at landfall
Southwest Western Australia Lack of Rainfall
- Very dry, below average rainfall
- Fires
Are these events due to greenhouse climate change or natural variability?
La Niña and Summer Rainfall
- La Niña was very high during the Australian summer; one of the strongest on record
- La Niña brings stronger trade winds, warmer seas around northeastern Australia, and higher rains to the northeastern Australian coast and Indonesia
- Australian summer was also warm in many parts of the country, including the west coast
- The heavy rains and floods of the Australian 1973 – 1974 summer also occurred during La Niña
Sea-Surface Temperatures (SSTs)
- December 2010 saw SSTs 20% warmer than any other year (in about 100 years) around not just the northeast coast, but much of Australia
- There has been a warming trend in December SST anomalies since 1900
Climate Change Signals
- The area getting heavy rain has been increasing
- Significant increase in warm nights agrees with models that show this amount of warming attributable to anthropogenic climate change
- It is believed that climate change has led to record high SSTs around Australia and higher moisture content, likely contributing factors to the increased rainfall
- HOWEVER, it’s too early to link precipitation to climate change models, as this is much more difficult and not statistically significant right now
- While Queensland landfalling tropical cyclones occur twice as often in La Niña years, there has been a marked decrease in severe landfalling tropical cyclones since 1870…this is in contrast to the IPCC claim that there should be an increase in severity on average everywhere…not sure why there is this discrepancy
—————————————
If you have any questions or comments, let me know! For some figures showing rainfall totals and anomalies across Australia, I refer you to a previous post I made, The Big Wet.
Permalink
03.15.11
Posted in Non-US Weather, Weather News at 8:00 am by Rebekah
This week’s post in the global weather and climate series features Sendai, Japan, one of the hardest-hit cities by last week’s 9.0 earthquake and ensuing tsunami.

Montage of Sendai, from Wikipedia
Founded in 1600, Sendai, known also by its nickname “The City of Trees”, is the capital of Miyagi Prefecture in Japan. The city is situated on the northeastern coast of Japan’s largest island, Honshu, and stretches from the Pacific Ocean to the Ōu Mountains. The highest point in the city is Mount Funagata (about 4,950 feet, or 1,500 meters tall). Sendai has a population of just over 1 million.
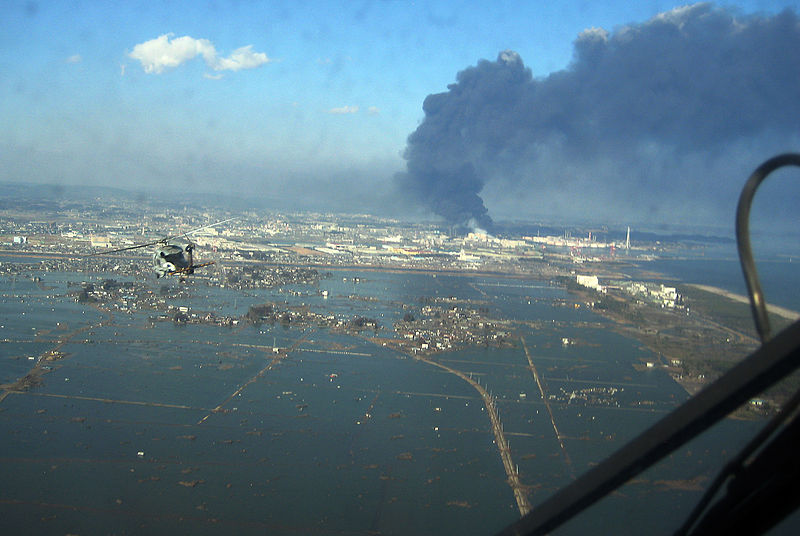
On Friday, March 11, a 9.0-magnitude earthquake and a tsunami of up to 33 feet (10 meters) tragically affected Sendai and many nearby cities. The following image, from Wikipedia (taken by the U.S. Navy), shows Sendai after the tsunami.
A few more facts about Sendai (from Wikipedia):
- Time zone: Japan Standard Time (UTC+9)
- Elevation: near sea level, but hilly
- Climate zone: Humid subtropical (cool, relatively dry winters and warm, wet summers)
- Average high temperature: 61 °F (16 °C)
- Average low temperature: 47 °F (9 °C)
- Average annual high/low temperature range: 41 to 82 °F (5 to 28 °C) / 28 to 70 °F (-2 to 21 °C)
- Average annual precipitation: 49 inches (1,242 mm)
- Average annual snowfall: 35 inches (90 cm)
Weather: The weather station in Sendai, located at Sendai Airport, stopped reporting as soon as the tsunami struck it, presumably damaging or destroying the instruments if not carrying them away. That being said, temperatures in the area have been fairly cool and typical for this time of year.
Currently, the primary surface feature near Japan is a surface low sitting off the east coast of the country, and this low will rapidly strengthen as it moves to the northeast.
Highs in Sendai this week will be around 40 °F until Saturday, when the temperature is expected to warm up to the mid-50s. Lows will range from the mid-20s to near 30 °F. There is a slight chance of some rain and snow almost every day and night this week (the greatest chance for snow is tonight).
Please keep the people of Japan and everyone affected by the recent disaster in your thoughts and prayers, including the aid workers and those working tirelessly and bravely to keep the nuclear damage at a minimum.
For weather maps and information on current and forecast Sendai weather, see the Japan Meteorological Agency, Weather Underground and Weather Online UK (maps and models).
For a bit more information on Sendai, here’s a link to Wikipedia
Next Tuesday I plan to take a look at the climate and weather in another part of the globe. As always, if you have any suggestions for future cities, please leave a comment!
Permalink
03.14.11
Posted in Weather Education at 8:00 am by Rebekah
Last week I described how upper-air observations are made with radiosondes. This week we’re going to start looking at remote sensing observing systems, beginning with radar.
Radar
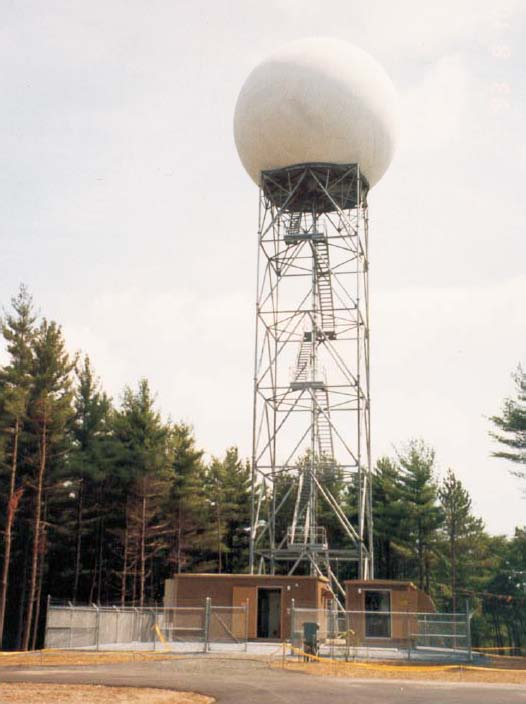
(Photo from the National Weather Service in Seattle)
Radar stands for radio detection and ranging. A radar system emits high power radio waves, some of which bounce off objects (e.g., raindrops and snowflakes) and return to the radar. The round-trip time of the energy pulse is used to calculate the distance of an object from the radar.
The current generation of weather radars in use by the National Weather Service is the WSR-88D, standing for Weather Surveillance Radar, 1988 Doppler. These radars, as you can probably guess, were established in the ’80s and are Doppler radars.
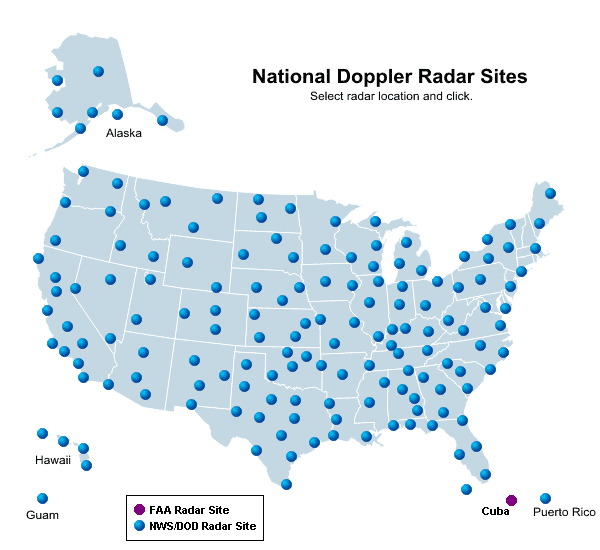
The following map shows the locations of the National Weather Service radars.
Doppler Radar
Consider a passing train, blowing its whistle. As the train moves away from you, the pitch of the whistle drops. The same goes for emergency vehicles; sirens will sound higher pitched as the vehicle is coming towards you, and lower pitched as the vehicle is going away from you.
This shift in frequency is known as the Doppler shift, and we can apply this principle to radars, in order to determine the wind speed and direction across the radar domain (e.g., useful in determining when a tornado may be present, where we have rotating winds).
Other Radars
There are numerous other types of radars used to observe precipitation and wind as well, such as dual-pol and phased-array radars and wind profilers.
A wind profiler is a type of radar or sodar (uses radio or sound waves) that points up and gives frequent updates on wind speed and direction over a certain location. This is helpful as we only have soundings go up twice a day, and sometimes we may want to know what the winds are doing in-between soundings. Most wind profilers are located in the central U.S.
————————————————–
Next Monday we will talk about weather satellites.
Permalink
03.13.11
Posted in Weather News at 8:00 am by Rebekah
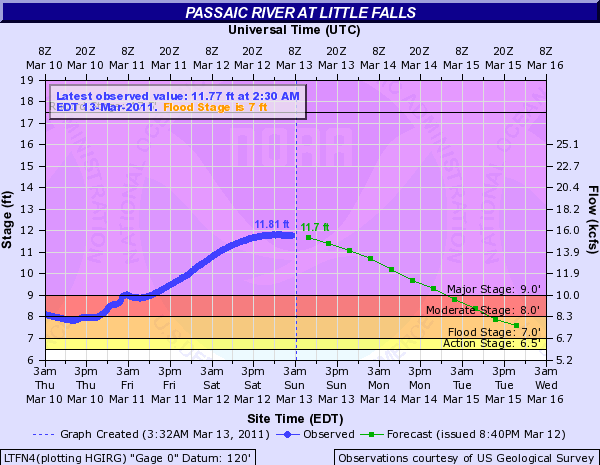
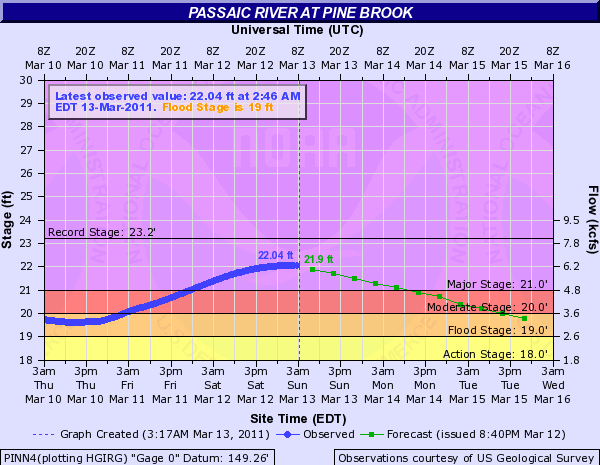
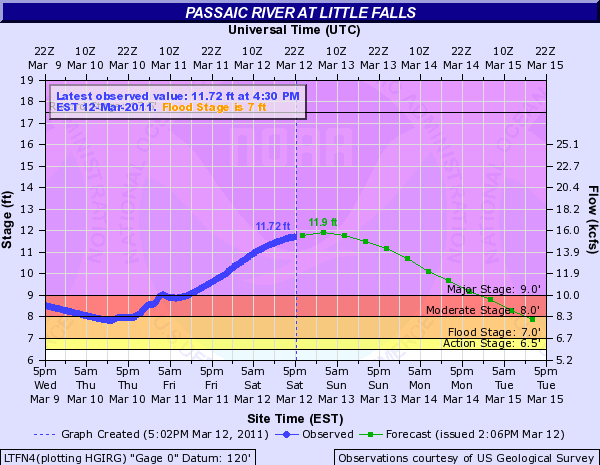
The Passaic River, in northern New Jersey, reached peak flood stage last night. The river gauge at Little Falls, New Jersey, recorded the 5th highest flood peak since records began.
Here are a couple of hydrographs from the Passaic River when it was near peak.
Little Falls (click to enlarge; click here to view the latest hydrograph and info for this station):
Pine Brook (click to enlarge; click here to view the latest hydrograph and info for this station):
Many other rivers in the Northeast rose quite a bit as well, forcing hundreds of people from their homes. The flood waters in some parts of northern New Jersey are not expected to recede for a few days.
The rivers have been rising as a result of heavy rains recently, on top of snow that is melting with more springlike temperatures. Much of the area affected should be rain-free for a little while now, though, and the river levels have already begun to drop.
Permalink
03.12.11
Posted in General News, Weather News at 8:00 am by Rebekah
Yesterday was a pretty wild day, from the Japanese earthquake and the Pacific tsunami to wildfires in Oklahoma and Texas and flooding in the Northeast.
Here are some U.S. tsunami amplitudes I found via the National Weather Service (note the amplitude is the height above normal sea level):
LOCATION – TIME – AMPLITUDE
———————————————–
PORT ORFORD OR – 1724UTC – 6.1FT/1.85M
ADAK AK – 1755UTC – 3.6FT/1.09M
KODIAK AK – 2211UTC – 0.9FT/0.28M
LOS ANGELES CA – 2115UTC – 1.7FT/0.51M
SAN DIEGO CA – 2131UTC – 1.7FT/0.51M
LA JOLLA CA – 2007UTC – 1.4FT/0.43M
WESTPORT WA – 1920UTC – 2.0FT/0.62M
ST PAUL IS. AK – 1228UTC – 2.1FT/0.65M
OLD HARBOR AK – 2154UTC – 1.1FT/0.33M
DUTCH HARBOR AK – 1204UTC – 1.3FT/0.41M
SHEMYA AK – 1136UTC – 5.2FT/1.58M
ARENA COVE CA – 1834UTC – 8.7FT/2.65M
CRESCENT CITY CA – 1656UTC – 8.2FT/2.49M
SAN FRANCISCO CA – 1749UTC – 2.1FT/0.64M
MONTEREY HARBOR CA – 2013UTC – 2.4FT/0.72M
NORTH SPIT CA – 1639UTC – 3.3FT/1.01M
PORT SAN LUIS CA – 1745UTC – 8.6FT/2.64M
SANTA BARBARA CA – 2229UTC – 3.2FT/0.97M
SANTA MONICA CA – 2223UTC – 2.8FT/0.84M
————————-
In other news, the Passaic River is still nearing its crest, now expect to peak around 12 feet tonight.
Also, Oklahoma yesterday was going up in flames (as well as parts of Texas and Colorado); the governor declared a state of emergency for the entire state, as we had at least three dozen or so wildfires burning as a result of strong winds (gusting to 47 mph), temperatures near 80, and very dry conditions. Several grass fires wound up burning a few homes, as firefighters were having a very difficult time trying to get these fires under control.
Permalink
« Previous Page — « Previous entries « Previous Page · Next Page » Next entries » — Next Page »


