04.21.11
Posted in Astronomy, Space Shuttle at 8:00 am by Rebekah
Yesterday I received an email with more details on the NASA Tweetup, including the schedule, which made me even more excited!! 🙂
Thursday, April 28/L-1: Tweetup Day 1*
7:30 a.m. to 9:30 a.m. – Registration at the Kennedy Space Center Press Accreditation Badging Building; travel to the press site, set up, meet fellow participants
10:00 a.m. – Welcome by @NASA team members Stephanie Schierholz and John Yembrick
10:07 a.m. – Meet the tweeps
10:45 a.m. – Demo of Extravehicular Mobility Unit (EMU) and Mark III spacesuits
11:00 a.m. – Lunch break
12:00 p.m.-1:40 p.m. — NASA TV starts for the formal #NASATweetup program, featuring:
· Dana M. Hutcherson, space shuttle Endeavour’s flow director, Kennedy Space Center
· Tara Ruttley, International Space Station associate program scientist, NASA’s Johnson Space Center, @ISS_research
· Astronaut Clay Anderson, @Astro_Clay, Expedition 15 flight engineer, STS-131 mission specialist, shuttle Discovery (April 5-20, 2010)
1:45 p.m. – Board tour buses
2:00 p.m. – Tour of NASA’s Kennedy Space Center, including visits to the Apollo Saturn V Center, a drive by the Shuttle Landing Facility, Mate-Demate Device, Orbiter Processing Facility, Vehicle Assembly Building and Mobile Launcher Platforms, and viewing of the retraction of the Rotating Service Structure, scheduled for 7 p.m.
8:15 p.m. – Return to the press site
Friday, April 29/ Launch: Tweetup Day 2
8:00 a.m. – Badges will get you in Kennedy Space Center Launch Complex 39 press site
9:00 a.m. – Group picture beside the countdown clock
9:05 a.m. – Astronaut Ricky Arnold, STS-119 Discovery (March 15-28, 2009)
9:30 a.m. – Astronaut Leland Melvin, associate administrator for Education, NASA Headquarters, @Astro_Flow
10:00 a.m. – Daire McCabe, designer at LEGO
10:30 a.m. – Lt. Col. Patrick Barrett, 45th Weather Squadron, U.S. Air Force
~11:57 a.m. – Astronauts depart their crew quarters for Launch Pad 39A
~12:10 p.m. – Tweetup participants (assembled along the road across from the Launch Control Center) wave to the crew as they drive by in the astrovan on their way to the launch pad
~2:15 p.m. – STS-134 Closeout Crew member (Endeavour’s hatch is closed and latched for launch at ~1:42 p.m. EDT)
3:47 p.m. – Launch of space shuttle Endeavour on the STS-134 mission
~5:00 p.m. – Post-launch news conference on NASA TV
Following the launch, you are free to depart on your own schedule. If you leave immediately, be prepared to sit in traffic for quite some time.
*Program speakers and times are subject to change
(In the event of a 24-hour delay, we will invite you back for a launch opportunity on April 30; the timeline would move about 30 minutes earlier)
————
A number of celebrities have announced that they will be there to view the launch as well, including actors LeVar Burton, Seth Green, and Clare Grant (all of whom will be attending the Tweetup) and Representative Giffords and President Obama and family (viewing from nearby).
Let’s hope for good weather!
Permalink
04.20.11
Posted in Astronomy, Space Shuttle at 8:00 am by Rebekah
Yesterday after the flight readiness review for space shuttle Endeavour, NASA voted unanimously to make the April 29th launch date official. This means that barring some unforeseen circumstance, such as a last-minute malfunction or weather problem, space shuttle Endeavour will launch at 3:47 pm EDT on April 29.
Those of us planning on going to see the launch breathed a collective sigh of relief, and now I feel that the NASA Tweetup, space shuttle launch, and Florida trip is a bit more real.
I really don’t think it will begin to sink in until I am on the road, though, in just a few days.
Next week I expect I will be blogging more about my trip than about the weather, and hope to post some of the best photos (from both the Southeast road trip and the Tweetup and launch) as soon as possible. I may also stream part of the event, if it’s not too much trouble, but you can always watch the launch preparations and launch itself live on NASA TV.
9 days until launch! 🙂
Permalink
04.19.11
Posted in Non-US Weather, Weather News at 8:00 am by Rebekah
This week’s post in the global weather and climate series features Hanga Roa, Easter Island.

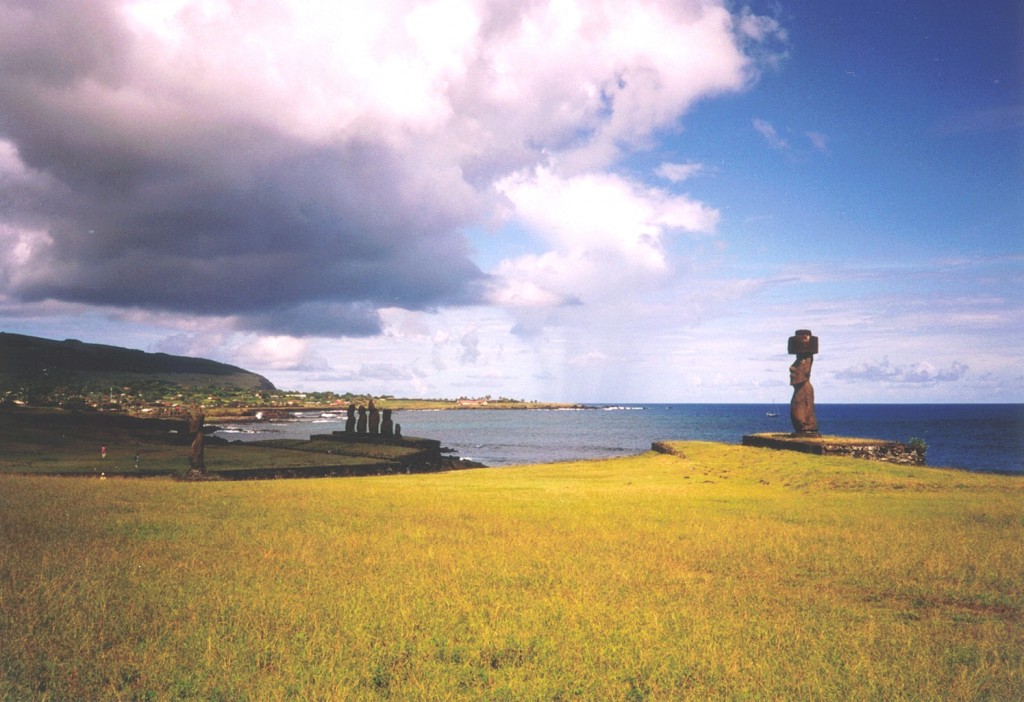
Hanga Roa, Easter Island, from Wikipedia
Hanga Roa (sometimes Hangaroa) is the main city and capital of Easter Island (aka Rapa Nui or Isla de Pascua), a territory of Chile. Easter Island is a small, Polynesian island in the southeastern Pacific Ocean, most famous for the monolithic human statues known as moai. The island got its name from the Dutch explorer Jacob Roggeveen, who on Easter Sunday 1722, became the first known European to land there.
Hanga Roa, on the southwest coast of Easter Island, is located at 27 °S. The island is nearly 1,300 miles east of Pitcairn Island, the nearest inhabited island, and nearly 2,200 miles east of Chile, making Easter Island one of the most isolated inhabited islands in the world. The population of Hanga Roa was 3,791 in 2002, making up 87% of the population of the entire island. Primary industries in the city include tourism, fishing, and farming. There is also an airport (the only airport on the island) and a multi-use stadium, home to the island’s football team.

Hanga Roa harbor, from Wikipedia
A few more facts about Hanga Roa (from Wikipedia):
- Time zone: Standard Time (UTC – 6) or Daylight Saving Time (UTC – 5)
- Elevation: varies…begins at sea level, weather station at 167 ft (51 m)
- Climate zone: Humid subtropical
- Average high temperature: 73 °F (23 °C)
- Average low temperature: 66 °F (19 °C)
- Average annual high/low temperature range: 68 to 79 °F (20 to 26 °C) / 61 to 71 °F (16 to 21 °C)
- Average annual rainfall: 44 inches (1,125 mm)
Weather: Thanks to Hanga Roa’s location in the subtropics and on the coast of a small island, the temperature stays mild and fairly constant throughout the year. Precipitation is ample, but not as high as on islands in the southwestern Pacific.
Currently in the southern hemisphere fall, Hanga Roa is expecting highs around 77 °F, lows around 68 °F, and a slight chance of rain every day this week (personally, I think that might get a little boring after a while…but it could be a nice place to visit).
For weather maps and information on current and forecast Hanga Roa and Easter Island weather, see the Dirección Meteorológica de Chile, Weather Underground and Weather Online UK (global maps and models).
Here’s a Wikipedia link for Hanga Roa, and here’s a Wikipedia link for Easter Island.
Next Tuesday I may take a look at the climate and weather in another part of the globe, but I will be on my way down to Florida for the space shuttle Endeavour’s launch, so I might put the series on hold for another week or two. As always, if you have any suggestions for future cities, please leave a comment!
Permalink
04.18.11
Posted in Weather Education at 8:00 am by Rebekah
Last week in the weather education series we looked at contouring weather maps, in an effort to make the weather data easier to quickly understand. Now that we have covered surface maps, we’ll move on to making sense of upper-air maps.
Pressure Surfaces
Before we study the data shown on an upper-air map, we first have to understand what an upper-air map is.
Most of the time, when looking at upper-air maps, meteorologists are looking at the observations on a constant pressure surface rather than a constant height/altitude surface. This means that no matter where you look on that map, the pressure will be the same.
For example, a 5,000-m map would be a slice of the atmosphere at 5,000 m, such that everywhere on the map is 5,000 m above sea level. You would then have observations across the map reporting different pressure readings.
On the other hand, a 500-mb map would be a slice of the atmosphere at 500 mb, such that everywhere on the map has a pressure reading of 500 mb. In this case, you would have observations across the map reporting different altitude readings (i.e., at what height the pressure 500 mb was found).
This may sound somewhat strange, but it is customary for meteorologists to use pressure, rather than altitude, as a vertical coordinate, in order to simplify thermodynamic computations (we won’t get into that here).
Common Pressure Surfaces
Here are some common pressure surfaces that we look at, and the approximate altitude of each (varies by latitude, time of year, and atmospheric factors):
- 850 mb — 1.5 km
- 700 mb — 3.0 km
- 500 mb — 5.5 km
- 300 mb — 9.0 km
- 250 mb — 10.5 km
- 200 mb — 12.0 km
(Remember that pressure decreases with height, and standard sea-level pressure is 1013 mb.)
500 mb is a standard pressure surface for the mid-levels of the atmosphere…if I could only look at one upper-air map, I’d pick this one, so I can get a good overview of troughs, ridges, and mid- to upper-level winds.
The jet stream (band of fast moving air that circles the globe, high up in the atmosphere…more on this in a future post) is best seen on a 200 mb, 250 mb, or 300 mb map. We’ll get more into what levels are good for what later on.
Upper-Air Map Example

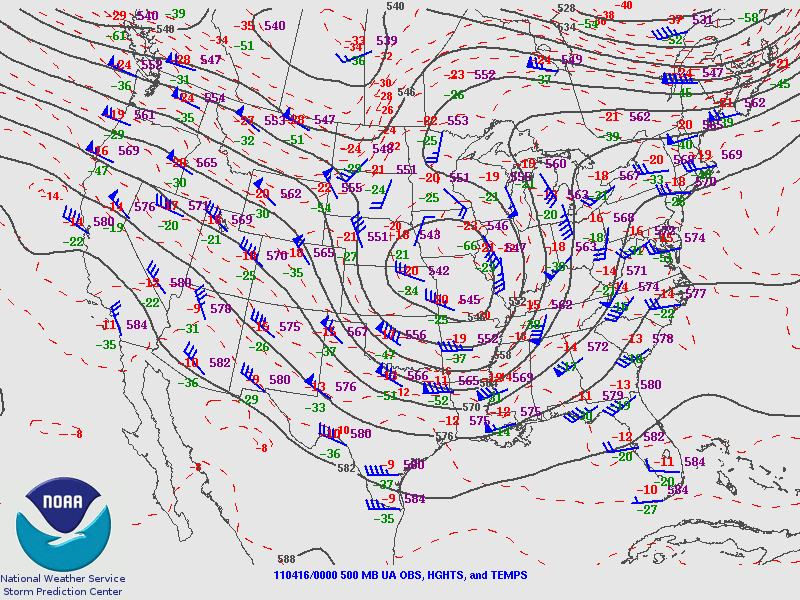
Here is an example of an upper-air map from the Storm Prediction Center (more maps can be found here).
The bottom of the map (click to enlarge) tells you what the map is showing: 110416/0000 500 MB means this is a 500-mb (mid-level) map containing data from 16 April 2011 at 00Z, or 7 pm Friday if you live in the US central time zone. UA OBS means upper-air observations are shown, HGHTS means the pressure heights are contoured (solid gray), and TEMPS means the temperatures are contoured (dashed red).
Upper-air symbols are interpreted much the same way as surface symbols, except for surface temperature and dewpoint are given in °F in the US, while upper-air temperature and dewpoint are always given in °C (don’t ask me why!). Also, remember that instead of pressure observations at each station, we report height observations (e.g., the altitude at which the pressure reads 500 mb).
There are also some special rules about interpretation of height values, such as in this case the units are decameters, so a value of 584 means 5,840 meters. For now anyway, though, the values are not that important.
The important thing here is to note the overall pattern. There was a trough of low pressure over the central US this day, and a ridge of high pressure over the eastern US. Later in the series we’ll get more into what these terms mean.
————————————————–
Next Monday we will move on to interpreting balloon soundings, another type of weather map/chart!
Permalink
04.17.11
Posted in Severe Weather Post-analysis at 8:00 am by Rebekah

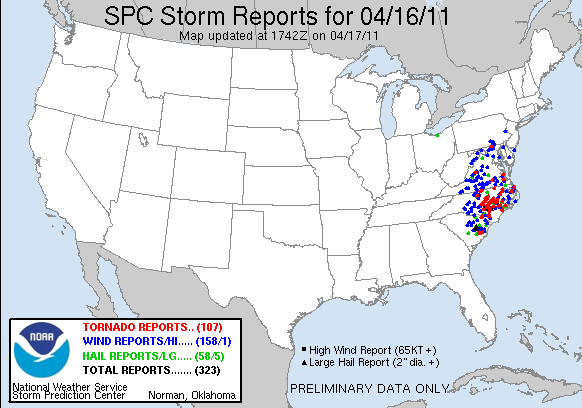
There were another hundred or so tornado reports yesterday, most of which were in North Carolina. The actual number of confirmed tornadoes will be generally be less than the number of tornado reports, but the last three days have been especially impressive in terms of large tornadoes. Sadly, a number of people have been killed and there has been some significant damage.
I do think the Storm Prediction Center did pretty well in forecasting this outbreak; unfortunately many of the tornadoes just went through fairly high populated areas.
Permalink
« Previous Page — « Previous entries « Previous Page · Next Page » Next entries » — Next Page »


