12.05.12
Posted in Weather News, Winter Weather at 6:53 pm by Rebekah
Yesterday I showed a couple maps from the NWS depicting recent precipitation in Washington; now let’s take a look at precipitation across the entire lower 48.
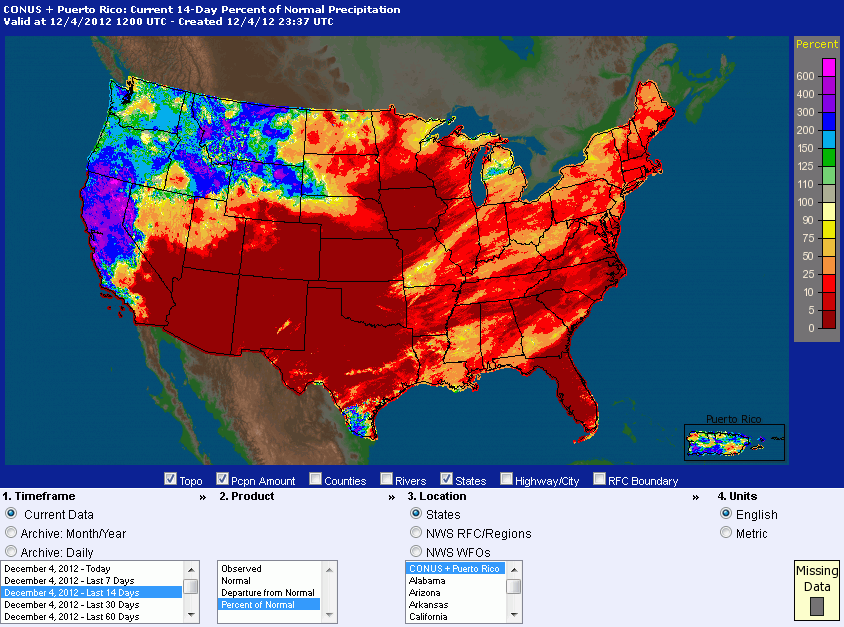
Percent of normal precipitation across the CONUS and Puerto Rico over the last 14 days (click to enlarge), from the NWS.
Two things immediately stand out to me here.
- The majority of the US has been very dry in the last couple weeks. Actually many of these regions have been in a drought for quite some time. It’s also been abnormally warm in places; some of my friends in Oklahoma and Texas have been happy (or unhappy) at the unseasonably warm temperatures lately.
- The West Coast has been abnormally wet lately. As I’ve talked about recently, parts of the West Coast have been pounded with strong weather systems bringing lots of warm, moist air, leading to heavy rains, floods, and landslides. California has been hit especially hard. Large parts of the state have seen over 300% (even over 500%) of their normal rainfall recently.
As to what we can expect for this winter, it can be hard to say. Early predictions for the season, which are usually based heavily on the phase of ENSO (El Niño / La Niña), were shaken up after the expected El Niño failed to develop. We’re currently in a neutral phase, which means there isn’t a high degree of confidence in the season-long predictions.
Still, here’s the latest outlook from the Climate Prediction Center.
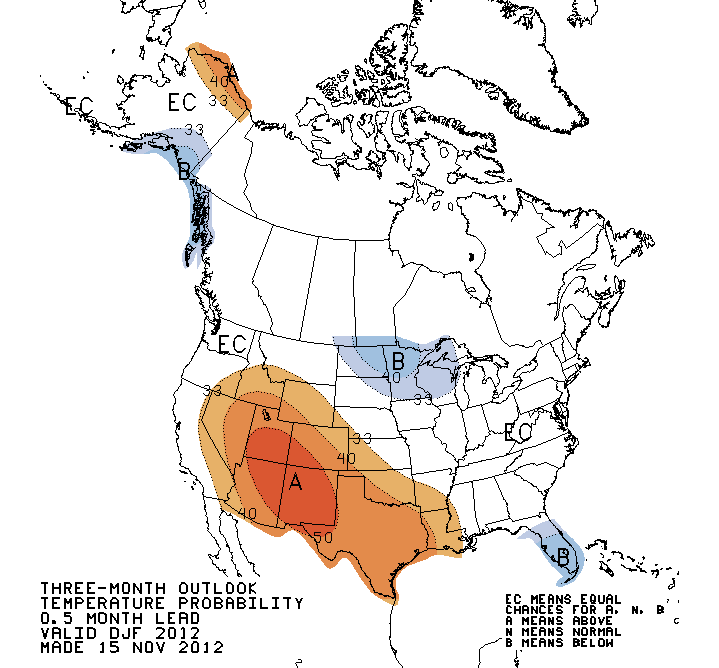
December through February temperature probability outlook. This shows a good chance for a warmer-than-normal southwestern US, with a colder-than-normal upper Midwest (I have a friend in North Dakota who isn’t too excited at the prospects of his first full winter there being a particularly chilly one!) and Florida.
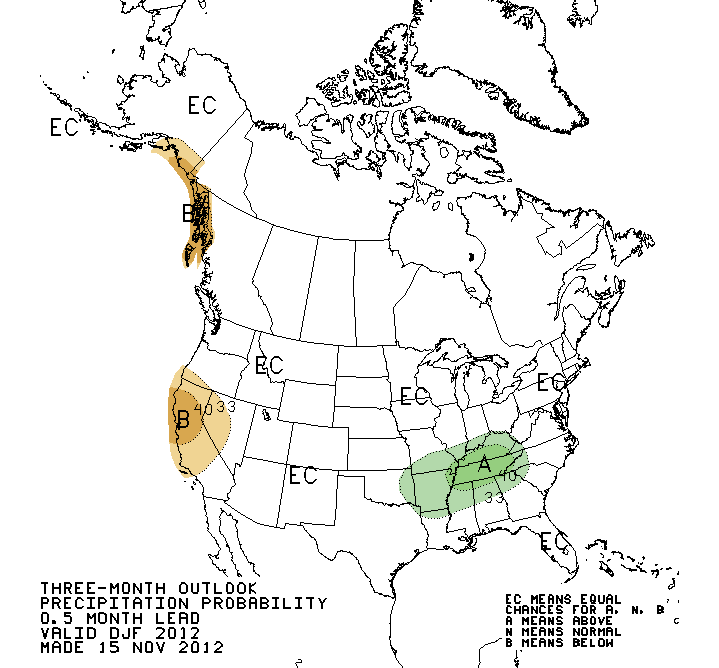
December through February precipitation probability outlook. Looks pretty normal except for a decent chance of a drier-than-normal California and a wetter-than-normal Kentucky and Tennessee. So far the prediction isn’t looking very accurate for California, but after a wet start to the winter, I’m sure they’re hoping they start trending more towards this forecast!
Permalink
12.04.12
Posted in Weather News at 7:09 pm by Rebekah
As I get back to weather blogging as promised when I began the overhaul of my website this summer, I’m bringing back the once popular World Wide Weather series, in which I highlight a place and take a look at the local weather and climate.
This week’s post features Hoquiam, Washington, on the west central coast of the state and currently experiencing a heavy rain event mentioned earlier this week (“Staying Connected“).
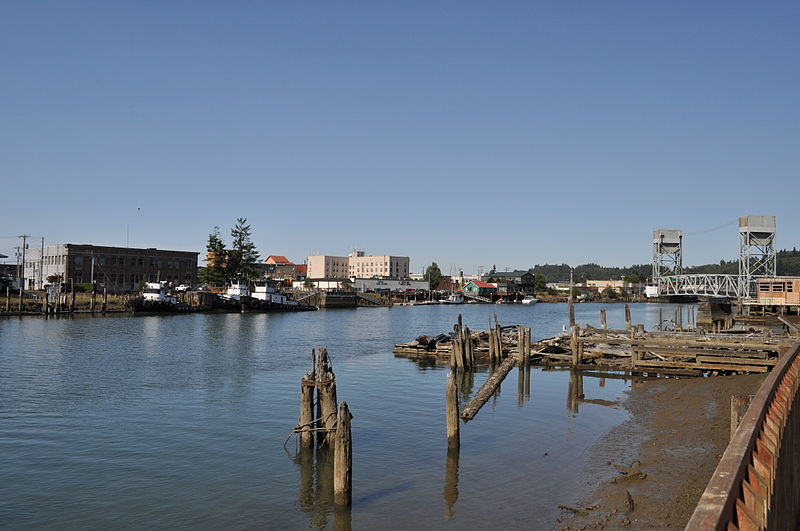
Hoquiam waterfront (US Route 101 bridge on right), photographer Joe Mabel, from Wikimedia Commons.
Hoquiam is situated on the southwest coast of Washington State, just inside Grays Harbor and at the mouth of the Hoquiam River.
The city’s history is primarily centered around logging and the export of lumber. Hoquiam was incorporated in 1890 and the town name comes from a Native American word for “hungry for wood”.
Every September, Hoquiam is host to loggers from around the world who come to the “Loggers’ Playday”, featuring a street fair, parade, logging competition, and fireworks. Other festivals include the River Festival and a world-famous Shorebird Festival, at which time hundreds of thousands of migrating shorebirds stop over at the Grays Harbor estuary.
A few more facts about Hoquiam (from Wikipedia):
- Time zone: Pacific Standard ( UTC – 8 ) or Pacific Daylight ( UTC – 7 )
- Elevation: 20 ft (6 m)
- Climate zone: Mediterranean / Oceanic
- Average high temperature: 58 °F (14 °C)
- Average low temperature: 44 °F (7 °C)
- Average annual high/low temperature range: 47 to 68 °F (8 to 20 °C) / 37 to 53 °F (3 to 12 °C)
- Record high temperature: 99 °F (37 °C)
- Record low temperature: 9 °F (-13 °C)
- Average annual precipitation: 69 inches (1,761 mm)
- Average annual snowfall: 5 inches (13 cm)
Weather: Hoquiam’s climate is considered Mediterranean, due to the mild and dry summers (driest month is July with an average of 1.2 inches of precipitation) and cool and wet winters (wettest month is November with an average of 10.7 inches of precipitation). The climate can also be considered oceanic, as the Pacific Ocean keeps temperatures mild without much variation throughout the year. Also thanks to the moderating effect of the ocean, snow is rare and does not fall most years.
We’re currently in Hoquiam’s second rainiest month of the year on average, which this year is starting off particularly wet. As I mentioned in the post a couple days ago about a river of atmospheric moisture moving towards the Pacific Northwest, heavy rains are starting to fall along the coast on soil that is already heavily saturated. Wind Advisories are also being posted by the National Weather Service for winds of 20-35 mph and gusts to 50 mph, which in combination with the wet soil will probably knock out some trees and power lines over parts of the western side of the state. A few rivers in the area are also expected to crest at minor flood stage.
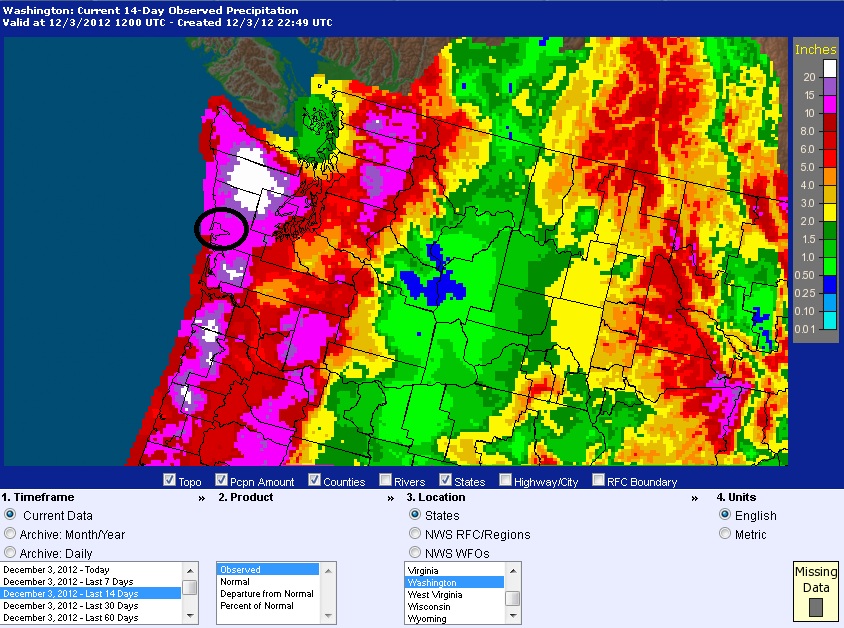
Observed precipitation for Washington over the last 14 days. Grays Harbor is circled. Courtesy of the NWS.
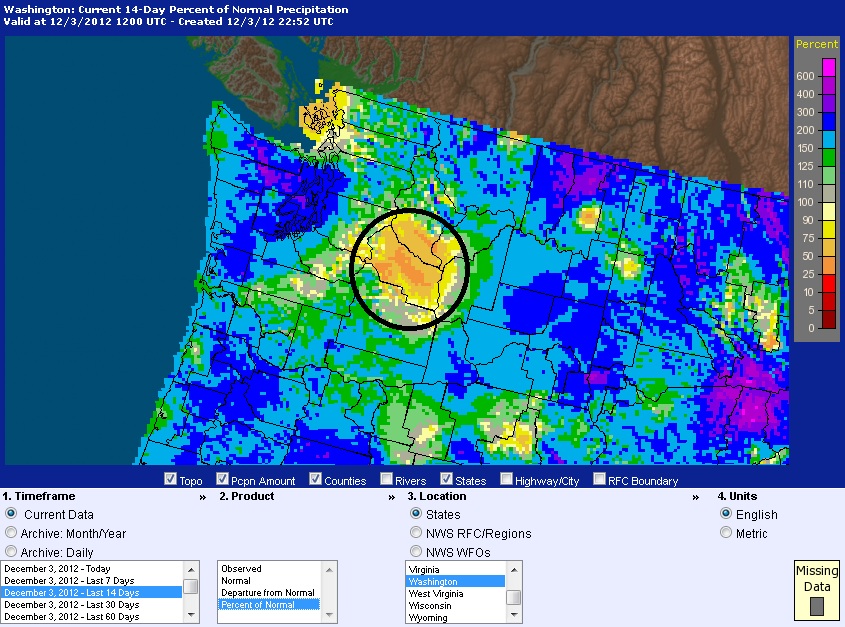
Percent of normal precipitation for Washington over the last 14 days. Note Grays Harbor and most of the coast is 150 – 300% above average. Kittitas County (circled), on the other hand, where my parents live just east of the Cascades, has been pretty dry for a while now and is still the driest place in the state! Courtesy of the NWS.
For weather maps and information on current and forecast Hoquiam weather, check out the local NWS page (looks rainy all week!). For more information on Hoquiam, see Wikipedia and the City of Hoquiam page.
Permalink
Posted in Non-US Weather, Tropical Weather, Weather News at 4:52 pm by Rebekah
Yesterday I posted about Typhoon Bopha and its proximity to the equator. Bopha went on to strengthen to the equivalent of a Category 5 on the Saffir-Simpson Scale, and made landfall in the Southern Philippines as a Super Typhoon with maximum sustained winds of 160 mph.
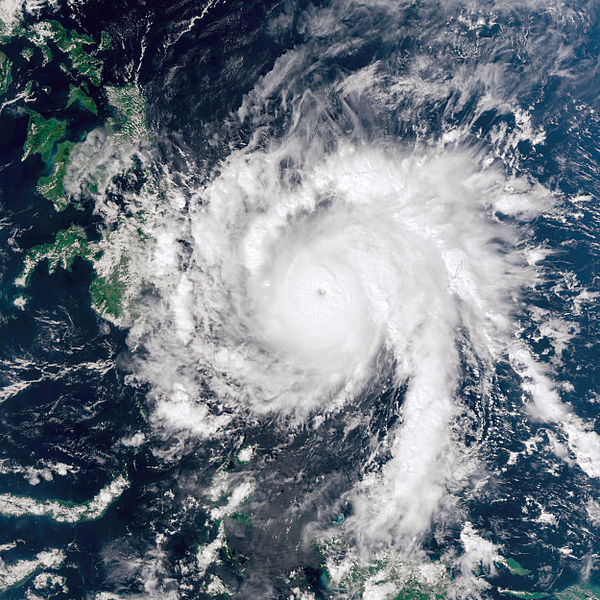
NASA image of Super Typhoon Bopha just prior to landfall in the Philippines. From Wikipedia.
To quote again from an article on The Weather Channel’s website:
“Dating to 1945, there have been only 4 other typhoons that have tracked within 200 nautical miles of Davao, Philippines (on Mindanao Island) with an intensity of at least a category-four storm, including Mike (“Ruping”) above:
- Mike “Ruping” (1990)
- Ike “Nitang” (1984)
- Kate “Titang” (1970)
- Louise:Marge “Ining” (1964)
Only “Ruping” and “Ining” were the equivalent of category-five storms.”
Furthermore, the article cites Dr. Jeff Masters of Weather Underground saying Bopha formed closer to the equator (at 3.8°N) than any other tropical cyclone on record, and nearly became the closest to the equator Category 5 storm (at 7.4°N). Only Super Typhoon Louise in 1964 was closer at Category 5 strength, at 7.3°N.
Permalink
12.03.12
Posted in Non-US Weather, Tropical Weather, Weather Education, Weather News at 5:09 pm by Rebekah
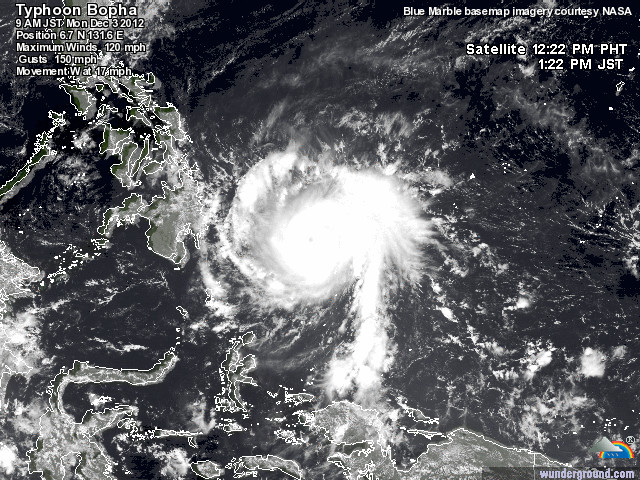
Typhoon Bopha narrowly missed Palau last night on its westward track through the west central Pacific. The typhoon has weakened slightly from the equivalent of a Category 4 on the Saffir-Simpson Scale to a Category 3 as it makes its way towards the southern Philippines.
It is unusual for a strong typhoon to exist so close to the equator; a recent article from The Weather Channel points out that Bopha is the strongest typhoon to track through the southern Philippines in 22 years.
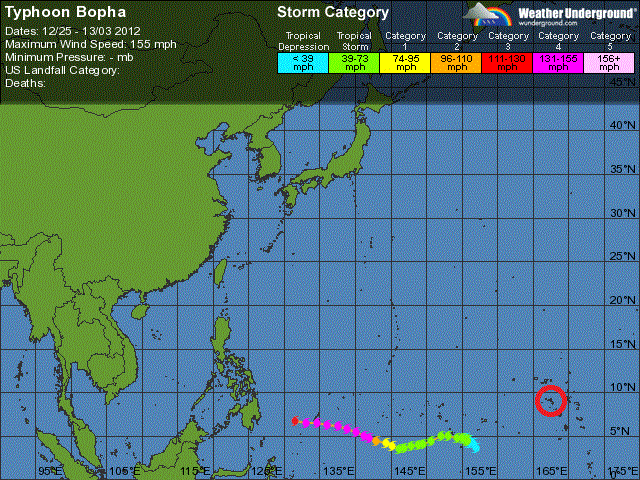
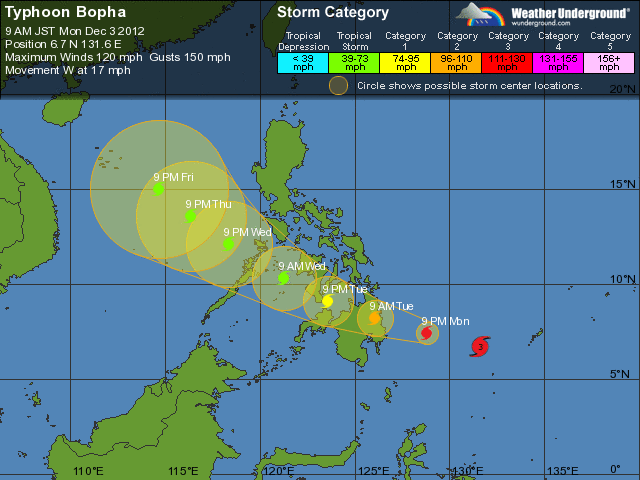
Bopha’s history (above) and 5-day forecast (below); Kwajalein Atoll (where I live) is circled in red. All images courtesy of Weather Underground.
But why is this unusual? Put simply, tropical cyclones require a certain amount of rotation to be able to strengthen. You probably know that wind in the Northern Hemisphere is deflected one way, while wind in the Southern Hemisphere is deflected the other way–this is known as the Coriolis force.
The closer you are to the poles, the stronger the deflection; which means the closer you are to the equator, the less the wind favors deflecting one way or the other. Even if you have all the other necessary “ingredients” for a tropical cyclone to form, if the trough of low pressure does not start to rotate, or does not rotate very much, the central pressure will fail to deepen and the wind speeds will not increase very much (remember, the stronger the pressure gradient, the stronger the winds as the atmosphere tries to balance out the pressure differences — see Meteorology 101: Elements of Weather – Wind).
Generally you will not see tropical cyclones forming between about 5°N and 5°S, let alone strengthening to Category 4 storms. This is why here at Kwajalein, at 8°N, we don’t expect we could get much more than the equivalent of a Category 2. Many tropical cyclones form near the Marshall Islands, but in order to get a stronger storm tracking through, it would need to form further upstream and closer to the equator, which is possible but not very common.
See also one of my previous posts on how tropical cyclones form: Tropical Cyclones: How They Form, Move, and Strengthen (aka, What Danielle, Earl, and Frank Are Up To) – Part 1
Permalink
12.02.12
Posted in Non-US Weather, Tropical Weather, Weather News at 5:16 pm by Rebekah
Here on an island with dial-up Internet at home and no cell phone service it can be hard to feel connected with the rest of the world sometimes.
However, even in an area with some of the least interesting (but perhaps most pleasant) weather in the world, you can still find global atmospheric connections.
Yesterday Kwajalein received 4.17 inches of rain. That’s not too unusual, but it’s still a pretty rainy day. The Christmas tree lightning and ceremony had to be postponed for a couple of days.
Meanwhile, my parents in the Pacific Northwest tell me that parts of the West Coast have been receiving good amounts of rain and snow due to “atmospheric rivers”. A while back I wrote a post on rivers of moisture, specifically the Pineapple Express (transporting atmospheric moisture from the tropical Pacific to the West Coast of the US) and the Rum Runner (tropical Atlantic to the UK and western Europe).
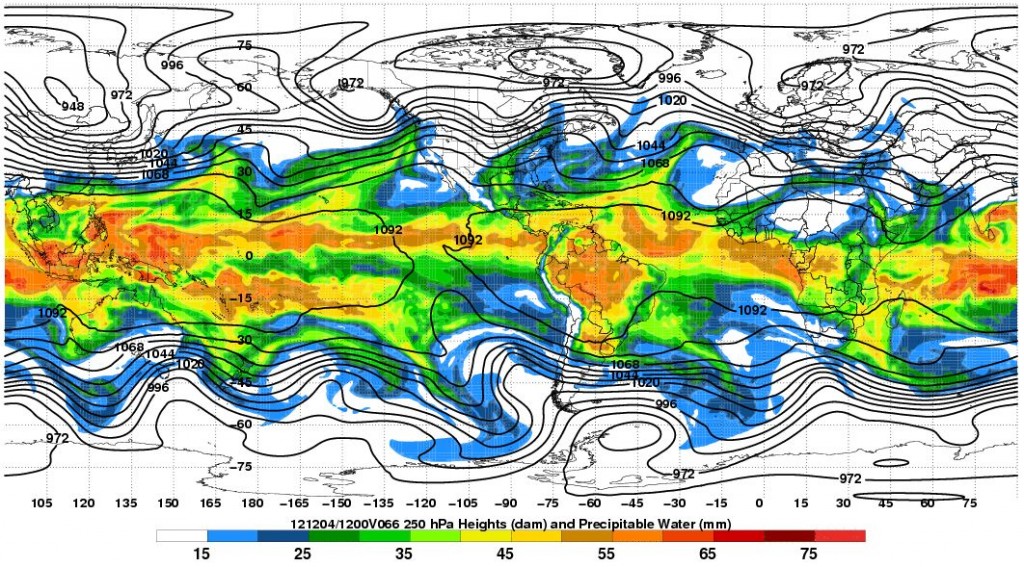
The following map (click to enlarge; from this precipitable water loop) shows the next moisture plume headed for the West Coast (green to yellow shading), and as you can see, most of that moisture can be traced back to Hawaii and points southwest of there. Kwajalein lies at about 8N, 167E, which on this map is in the middle of an orange band of juicy atmospheric moisture. Most of our moisture comes from the east and goes towards the west as we’re in the tropics, but it’s kind of cool for me to think that the moisture from all of our rain yesterday had pretty much the same source as the moisture headed towards my family.
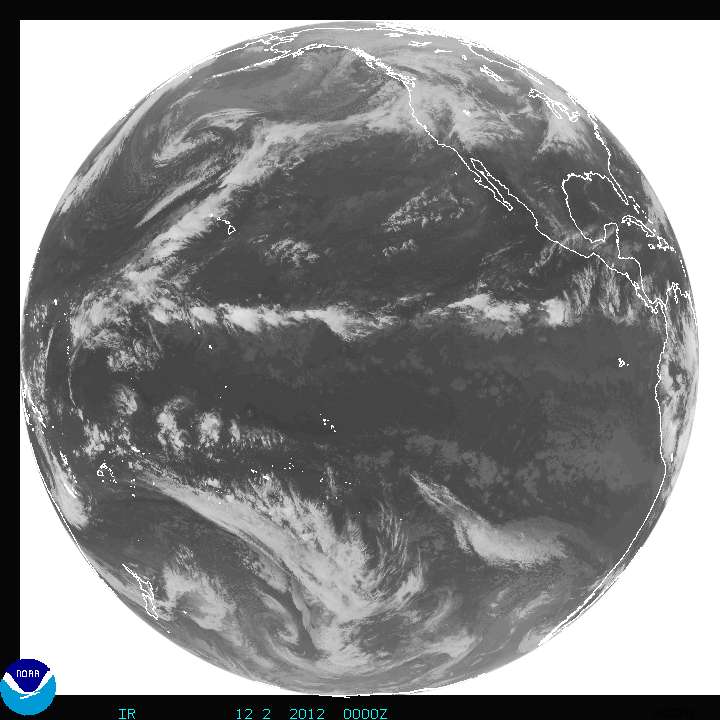
This MTSAT infrared satellite image shows the picture in a different way, with a band of clouds marching westward through the tropics and a band of clouds streaming northeastward from the tropics through Hawaii and on to the West Coast. This is one of many conveyor belts through the atmosphere that works to balance out an aspect of weather, in this case transferring warm, moist air from the tropics towards the poles!
Permalink
« Previous Page « Previous Page Next entries »


