02.11.10
A Confused Robin
Two days ago I saw a Robin in a tree near my apartment. I rejoiced, as I grew up with the notion that the first Robin of the year meant spring was on its way.
However, today in Norman we received nearly an inch of snow! The Dallas/Fort Worth airport received 8.7 inches today, breaking their record for the most snow in a day! Obviously, winter isn’t quite ready to release its icy grip yet.
The South is breaking snow records left and right, the East Coast is digging out of 3-ft+ of record-setting snow, California has been pummeled by storm system after storm system this winter, while the Pacific Northwest has been warmer than normal.
What’s going on? In the news, you may have seen a number of articles or TV segments where people are arguing over whether this winter is a sign of global warming, global cooling, or neither. As many scientists have said, it is foolish to look at just one year of extremes and to say that climate change is or is not occurring. Weather is the state of the atmosphere at any given time or place. Climate is the average weather at any given place over a long period of time. A singular weather event may be incorporated into a long-term average of weather, but one event does not give us enough information to infer anything about climate change.
On the other hand, there is a much more likely explanation for this winter’s wild weather, and I think it has a lot to do with natural, periodic, short-lived climate anomalies. Ever heard of El Niño? El Niño is one such climate anomaly that results in a warming of equatorial waters off the coast of Peru.
Normally, trade winds in the tropics blow from east to west. These winds push warm surface waters towards Australia. Near Peru, cold water rises up to take the place of the water that was pushed westward (this process is called upwelling). During an El Niño, the trade winds weaken or possibly even reverse direction. Warm, tropical waters stay warm across the equatorial Pacific and upwelling decreases or stops. This abnormal warming affects pressure patterns aloft (or the other way around; it’s a feedback process), which in turn may affect weather across the US. La Niña, which I’ll only mention briefly, is sort-of the opposite of an El Niño, where we just see “normal” go a little too far, so upwelling is stronger and cold waters are colder than normal.
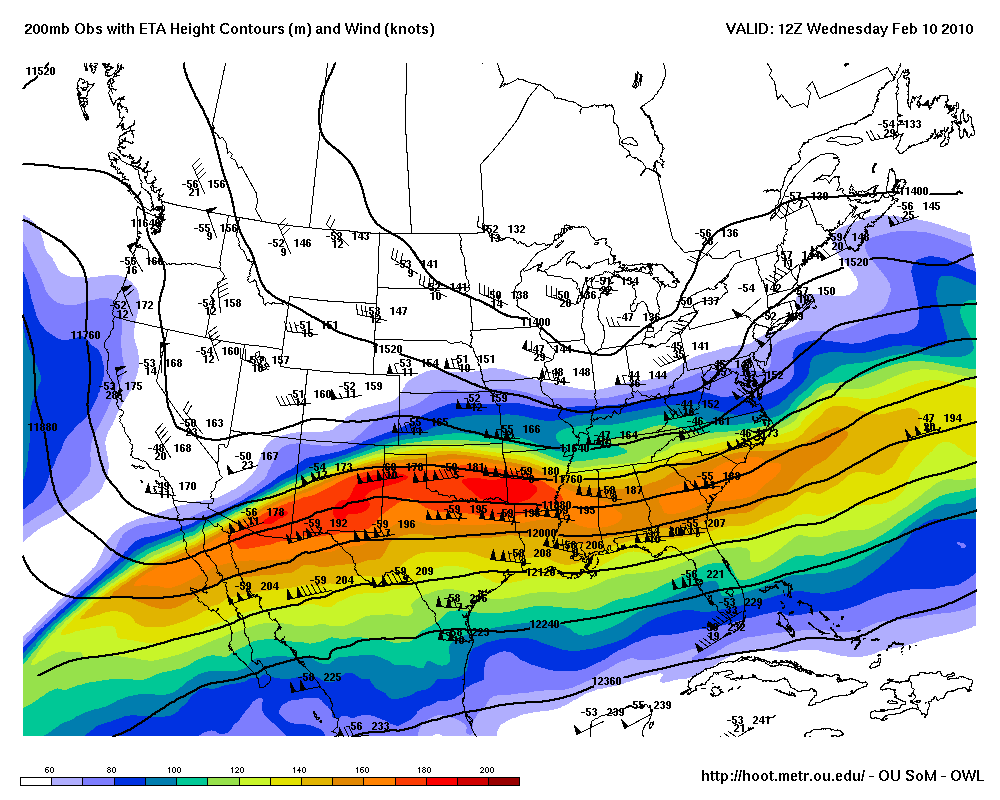
El Niño is at its strongest during the winter, when the subtropical jet stream is expected to become stronger than the polar jet stream. A stronger, more west-east oriented, southern jet will quickly bring many storm systems and a lot of moisture from the Pacific into the southern United States, while the Northwest will not get as many storm systems and will tend to be warmer and drier. We are currently coming down from the peak of a moderate El Niño, and we have certainly been seeing a strong southern jet stream bringing a lot of rain to California and a lot of moisture and storms to the Southern Plains.
The figure below is a graph of the MEI (Multivariate ENSO Index) since 1950, a measure of the strength of El Niños; positive values (in red) indicate an El Niño while negative values (in blue) indicate a La Niña.
The following image is an upper-air map at 200mb (near the top of the troposphere), showing the strong winds of the jet stream oriented west-east across the southern US (it was from Wednesday morning, 12Z).
This is only part of the story, though…there is another climate anomaly that occurs in the North Atlantic that could be linked to the cold air in the South and the East. I’ll talk about that in the next post!
Back to where I began–it is supposed to warm up to the mid-50s here on Saturday, but then we should get hit by yet another sub-freezing air mass…so that poor Robin had better stay away a while longer!

