02.10.11
The Big Wet
Parts of Australia have been flooding for the past couple of months now. With even more rainfall following Tropical Cyclone Yasi’s landfall last week, how is the country doing lately in terms of rainfall amounts and river heights?
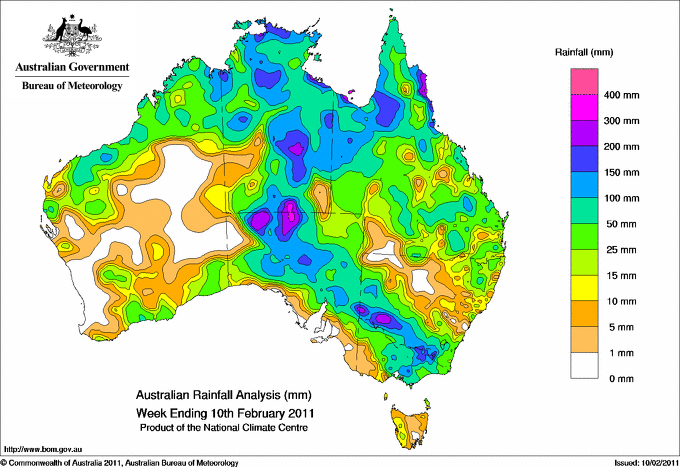
February 3 – February 10 rainfall totals (Bureau of Meteorology)
The biggest thing that pops out at me from this map is the swath of higher rainfall from northern Queensland southwestward to the south central part of the Northern Territory, as a result of Tropical Cyclone Yasi, as well as the swath of rain from north central South Australia southeastward through northern Victoria / southern New South Wales, as a result of a trough of low pressure.
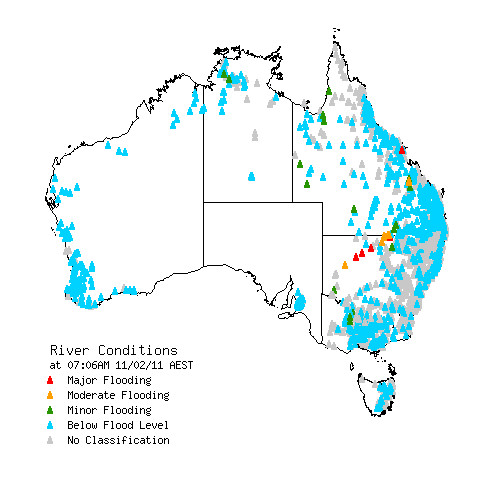
Current river conditions (Bureau of Meteorology)
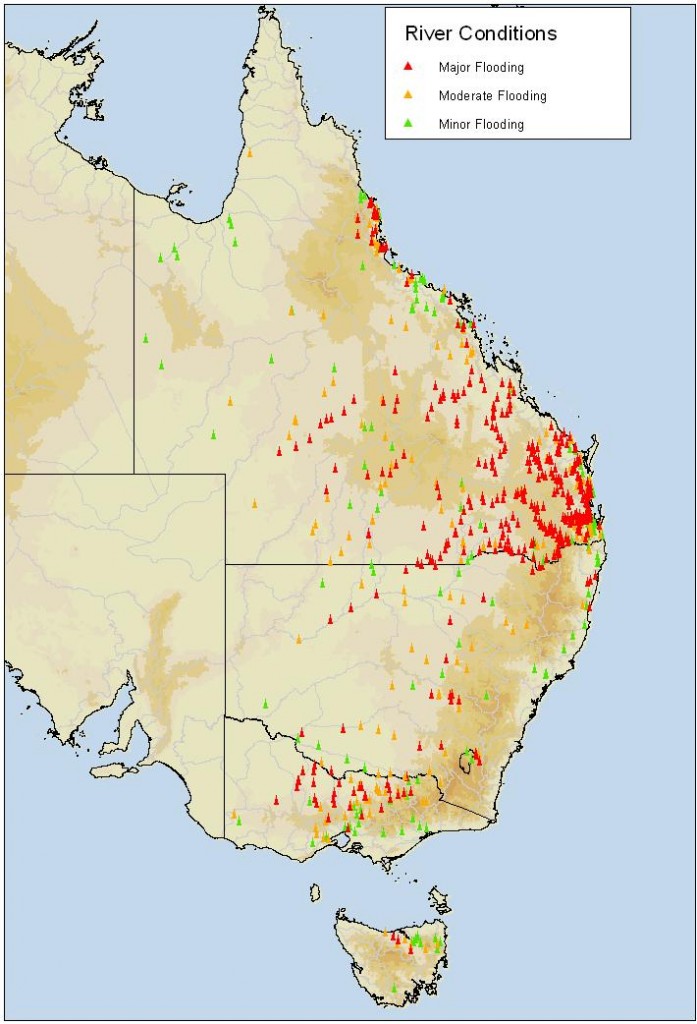
This map is better than those from a few weeks ago (see below); most of the rivers are below flood level now, with the exception of a few in Queensland and New South Wales.
November 26 – January 20 peak river conditions (Bureau of Meteorology)
Now for a look at some rainfall maps from over the past three months…
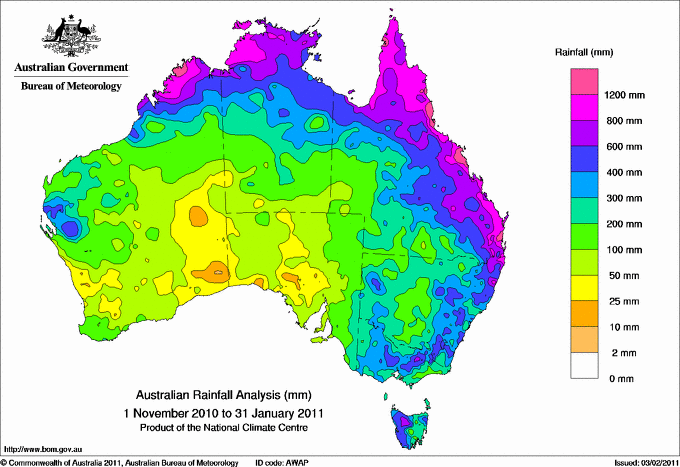
November 1 – January 31 rainfall totals (Bureau of Meteorology)
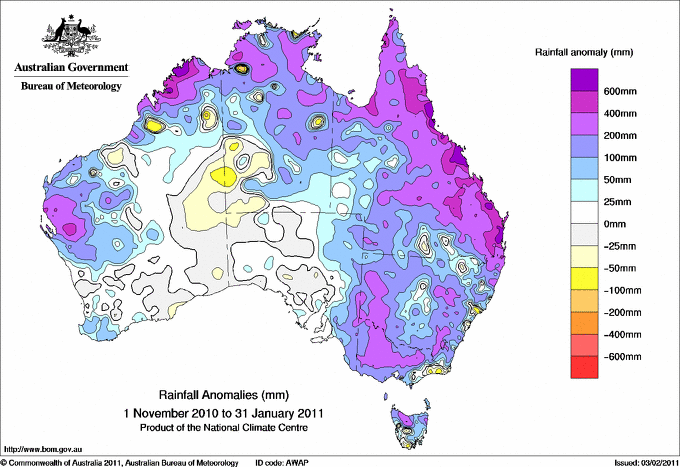
November 1 – January 31 rainfall anomalies (Bureau of Meteorology)
Wow, many coastal areas received well above average rainfall! Now how does this rainfall compare to the average rainfall?
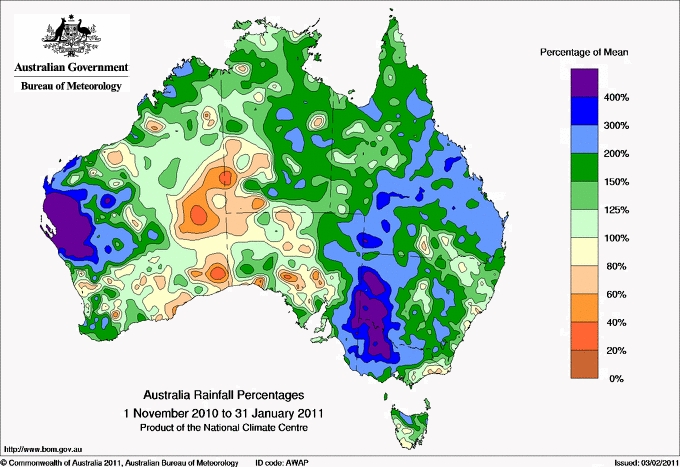
November 1 – January 31 rainfall percentages (Bureau of Meteorology)
Okay, so most of eastern Australia experienced above average rainfall from November through January. More specifically, western New South Wales and Victoria had well above average rainfall, as well as the west central coast of Western Australia.
Now how does this compare to the records?
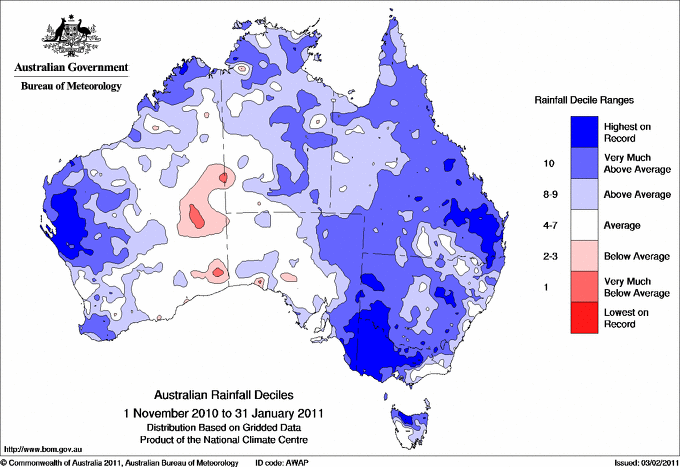
November 1 – January 31 rainfall deciles/records (Bureau of Meteorology)
This map shows that the rainfall in most of eastern Australia was well above average…much of Victoria, western New South Wales, and southeastern Queensland broke all-time rainfall records. That’s a pretty large record-breaking area! Note also that the west central coast of Western Australia has also received the highest amount of rainfall on record.
Has the rain affected the temperatures much? Absolutely.
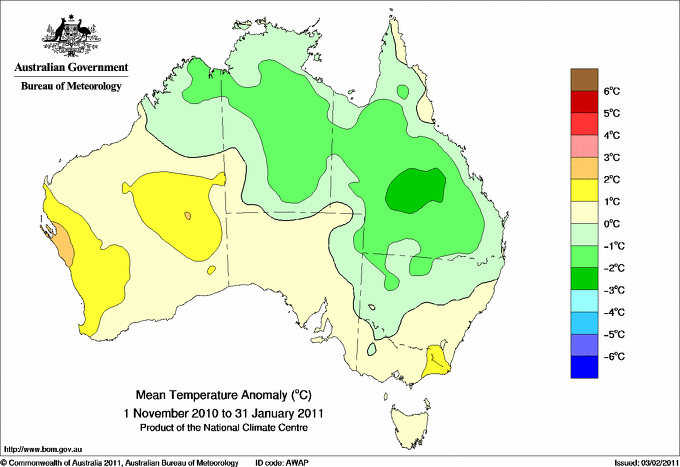
November 1 – January 31 mean temperature anomaly (Bureau of Meteorology)
It’s not a coincidence that Queensland’s average temperatures were lower from November through January…the clouds and rain contributed quite a bit to the slightly cooler weather.
For more on Australia’s climate data, check out the following links from the Bureau of Meteorology: Queensland in January 2011: Widespread flooding continued; Special Climate Statement 24 [on frequent heavy rains in late 2010 / early 2011, PDF document]; and Severe Tropical Cyclone Yasi [maps and info]. To see more of the above maps, check out the links posted in the captions.
One more thing: models show another tropical cyclone could develop in the Gulf of Carpentaria next week (and make landfall) and another cyclone off the coast of Western Australia by next weekend (though it would move away).
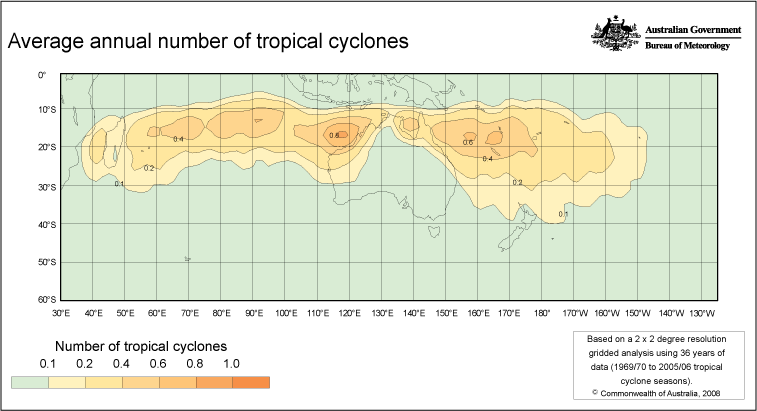
Here’s a map from the BoM showing the average annual number of tropical cyclones around Australia (click to enlarge):
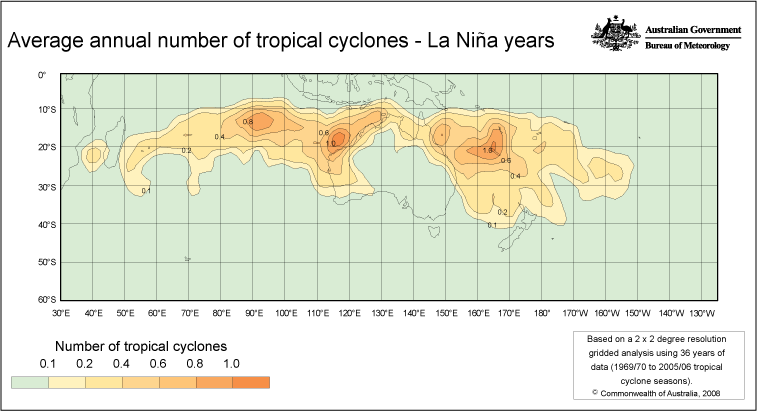
Compare that to a La Niña year, which we’re in now:
Stay tuned and stay safe!
Tweets that mention Green Sky Chaser » The Big Wet -- Topsy.com said,
February 11, 2011 at 8:55 pm
[…] This post was mentioned on Twitter by Rebekah LaBar, Rebekah LaBar. Rebekah LaBar said: Blog: "The Big Wet" – rain, river, and tropical cyclone maps for #Australia: http://bit.ly/gd2tcZ #TCYasi #thebigwet #flooding #qldfloods […]