03.02.11
Latest 2011 Tornado Stats
Yesterday marked the beginning of meteorological spring. This is also about the time when climatologically, tornado season begins to pick up.
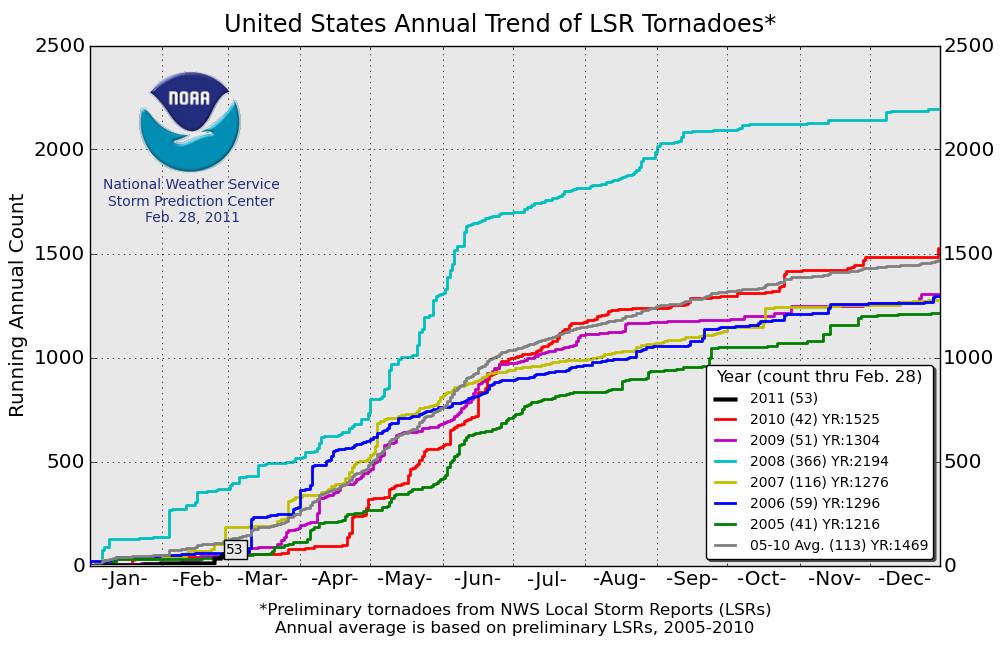
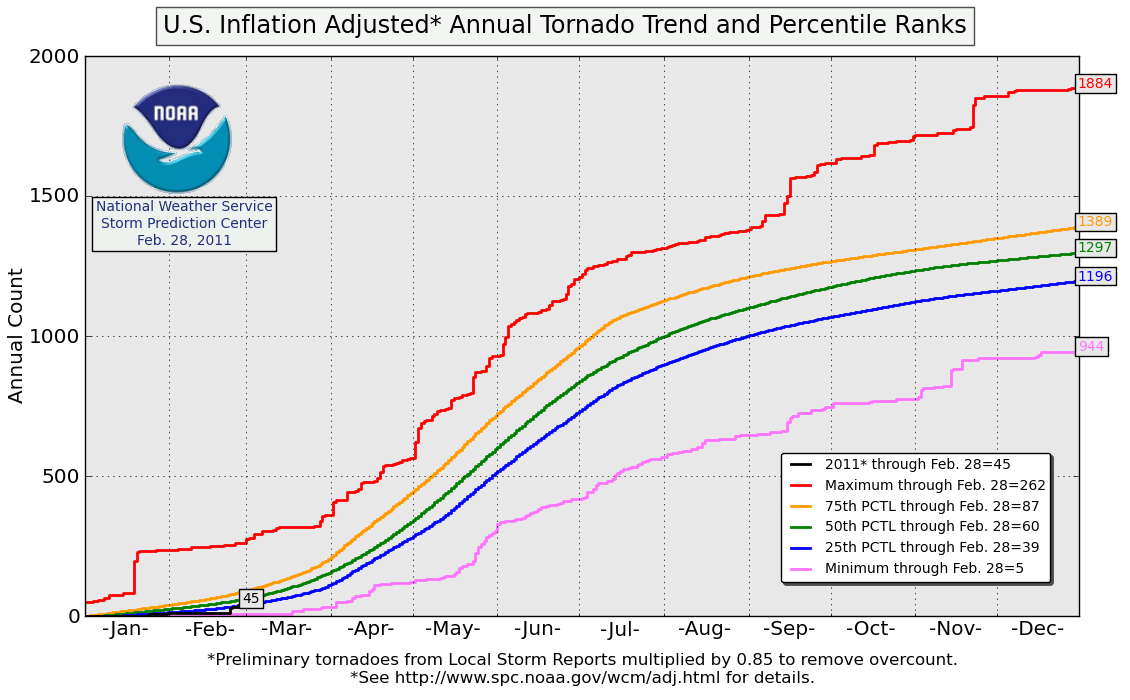
Here are a couple of plots from the Storm Prediction Center, showing where we are so far this year on tornadoes.
Through the first couple months of the year, there have been 53 tornado reports, which is below the 6-year running average.
The following graph shows the trend in local storm reports (LSR) of tornadoes in the U.S. Values may be a little higher than the actual tornado count (some tornadoes may have been reported more than once). The last six years are shown, as well as the current year up through February 28.
Now look at the graph below (click to enlarge), also from the Storm Prediction Center. This plot shows annual tornado trends; if you’re curious as to how exactly the trends were calculated, see the website on the bottom of the figure. Basically, the red line is the maximum tornado count in a single year and the pink line is the minimum tornado count in a single year. The other lines show tornado trends in quartiles. Currently, 2011 is just above the lowest 25th percentile.
Note the estimated number of tornadoes for 2011 so far is 43 (adjusted downward from the storm reports), though this value is not necessarily the same as the confirmed number of tornadoes.

