08.18.10
Tornado Tally – Minnesota Leads U.S.; U.S. Back Near Average
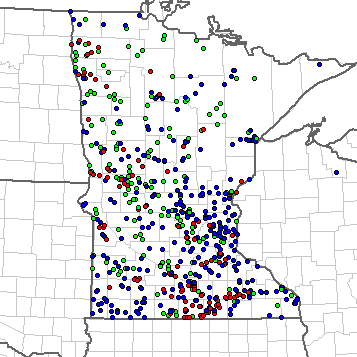
Minnesota has reported 123 tornadoes so far this year, more than any other state.
Texas comes in second, with 87 reported tornadoes.
Annual Severe Weather Report Summary – 2010, Minnesota. Red dots are tornado reports, green hail, wind blue. Courtesy of the SPC.
The most tornadoes in a year in recorded history in Minnesota was 74 in 2001. Not all of these 123 reports will be confirmed as tornadoes; generally the official tornado count is somewhat less than the number of reports, due to multiple reporting of the same tornado or mistakenly reporting a suspicious-looking cloud as a tornado. However, once the National Weather Service completes damage surveys and releases the official numbers next year, 2010 is likely going to break the record for most number of tornadoes in a year in Minnesota (in recorded history).
It is interesting to note that most of these tornadoes came on just a handful of outbreak days, most notably including June 17th (40+). June 17th also broke the record for the most tornadoes in a day in Minnesota history. The previous record was 27 tornadoes on June 16, 1992. Currently, 27 tornadoes have been confirmed with another 15+ likely to be confirmed at a later date. (See NWS Twin Cities report on the event for more.)
One of the reasons for increased tornado reports is the increased number of chasers and spotters observing storms. Also, the storm season didn’t really get going in the Southern Plains until mid- to late April; and by June, the storms had mostly shifted to the Northern Plains (and the season’s still going up there!).
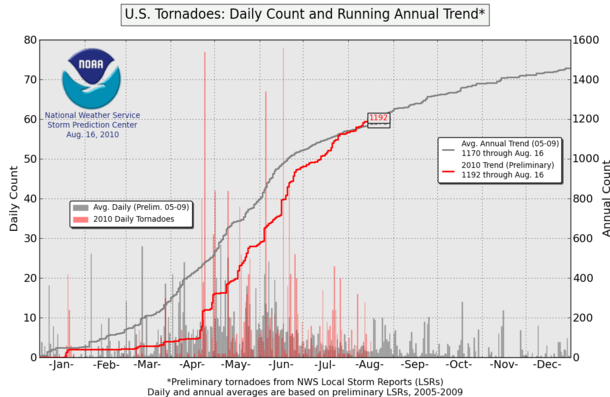
In other news, the U.S. is finally back near the 5-year average for the number of tornado reports.
The following plot shows the 2010 running count for tornado reports (remember, the actual number of tornadoes will be less) as compared to the 5-year average annual trend (gray line). The plot also shows the 2010 count and the average count for every day (outbreak days are pretty obvious).
U.S. Tornadoes: Daily Count and Running Annual Trend. Courtesy of the SPC.
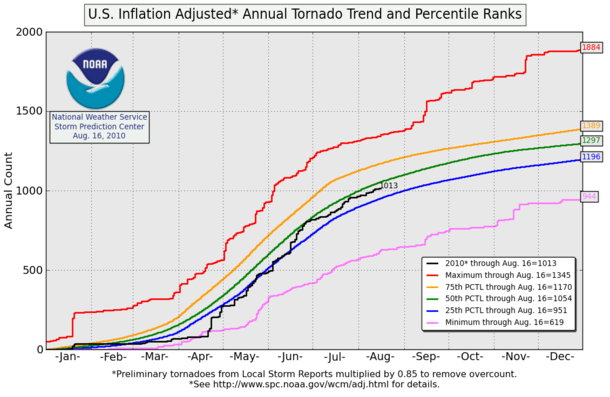
See also the annual tornado trend and percentile ranks as well (below). This plot has been adjusted to account for the overcount of tornadoes (hence “inflation adjusted”). As you can see, we are near the 50th percentile so far (i.e., near average, as the above plot showed too).
U.S. Inflation Adjusted Annual Tornado Trend and Percentile Ranks. Courtesy of the SPC.
Compare these plots with the plots I posted on the blog earlier this year:
April 14: Where Have All The Tornadoes Gone? – (and to think that I was concerned about the lack of tornadoes and chasing opportunities in mid-April…)
May 22: Tornado Season So Far…
For more tornado stats by state and to see what the top 10 active tornado days have been in the U.S. this year, see the SPC’s Annual Weather Report Summary.


