08.30.10
Posted in Non-US Weather, Severe Weather Nowcast, Tropical Weather, Weather News at 8:23 pm by Rebekah
There’s so much going on today weatherwise, it would be difficult to discuss it all, or even to just pick one topic. So tonight I’ll just stick with showing a few maps and noting a few highlights of each.
First up: tropical cyclones in the Atlantic.
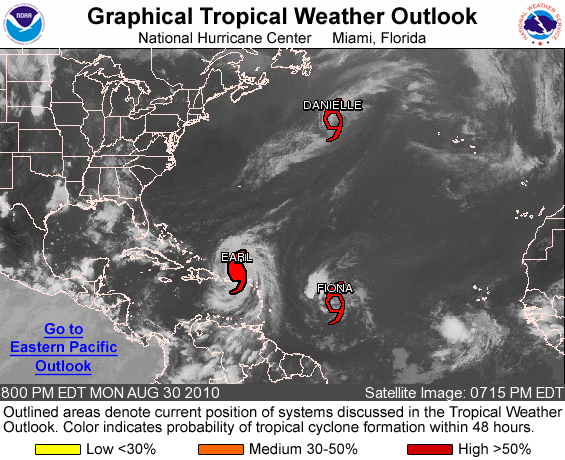
Figure from the National Hurricane Center.
The big story today is Earl, now a Category 4 hurricane with estimated sustained winds of 135 mph and a central minimum pressure of 938 mb, the lowest pressure in the Atlantic Basin since Hurricane Ike in 2008 (935 mb). Earl could become a borderline Category 5 hurricane tomorrow, when the cyclone is expected to peak at 150 mph (Category 5 has winds of over 155 mph).
Earl has brought heavy rain and strong winds to the Leeward Islands and Puerto Rico today, but is starting to move west-northwest away from Puerto Rico. Earl’s eye is expected to remain offshore, but some of the outer bands could affect the New England Coast by the end of the week.
Tropical Storm Fiona formed this evening, but is expected to remain weak. Danielle is now a tropical storm as well, moving well off into the north central Atlantic.
Second: tropical cyclones in the western Pacific.
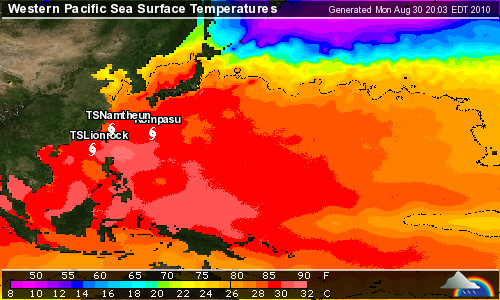
Figure from Weather Underground.
The western Pacific has been surprisingly quiet so far this year, but there are currently three tropical cyclones in this ocean basin as well. Typhoon Kompasu, with maximum sustained winds of 105 mph, is currently a Category 2 on the Saffir-Simpson scale and is forecast to become a Category 3 as it enters the East China Sea tomorrow. This typhoon is expected to hit the western North/South Korea border as a Category 2 on Thursday.
Tropical Storm Lionrock, with maximum sustained winds of 65 mph, is forecast to become a Category 1 tomorrow and make landfall as a tropical storm in southeast China (just west of Taiwan) on Thursday.
Tropical Storm Namtheun, with maximum sustained winds of 45 mph, is moving southwest and is expected to dissipate between Taiwan and China by Thursday, after running into Lionrock.
Third: severe thunderstorms in the Northern Plains.
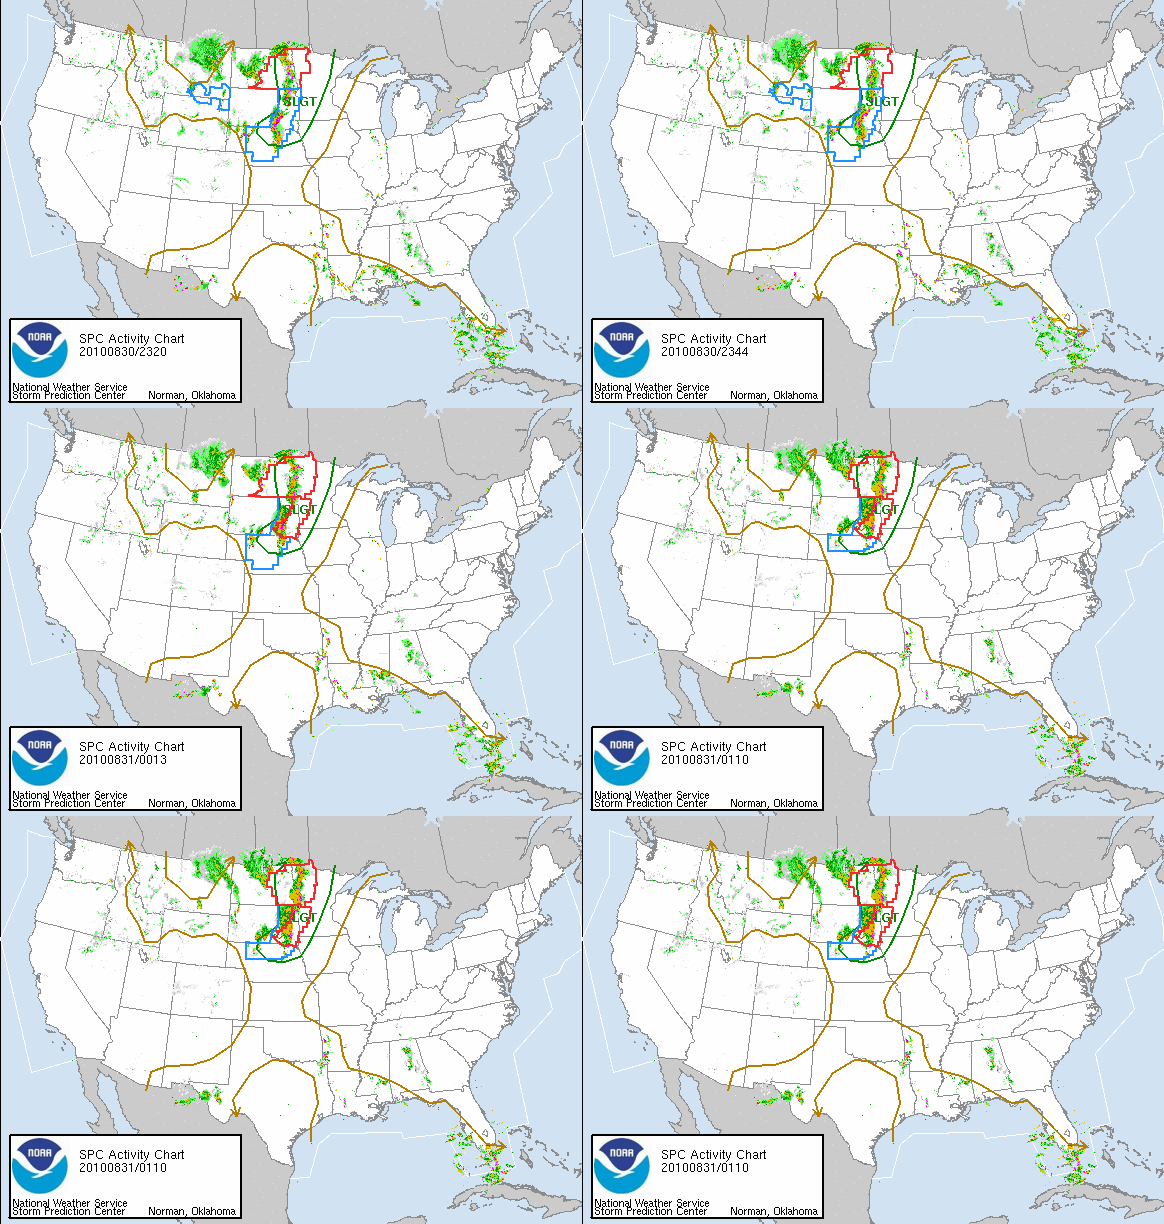
Figure from the Storm Prediction Center.
A trough in the western United States is providing a chance for severe weather today and tonight in the Northern Plains. There is currently a line of thunderstorms from the Nebraska/South Dakota border up into Canada. None of these storms are particularly strong at the moment, but there were tornado warnings out earlier this evening in South Dakota.
Fourth: rain and cooler weather in Oklahoma.
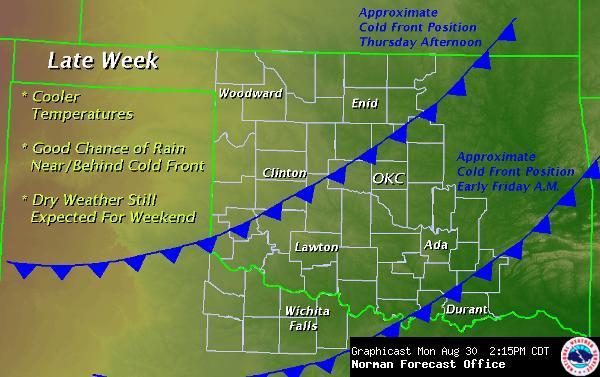
Figure from the National Weather Service in Norman.
We finally have showers and thunderstorms back in the forecast for this week! We are also expecting another cold front Thursday night, cooling down the temperatures a bit again for the weekend.
Autumn is on its way!
Permalink
08.24.10
Posted in Non-US Weather, Weather News at 6:20 pm by Rebekah
This week’s post in the global weather and climate series features McMurdo Station, Antarctica.
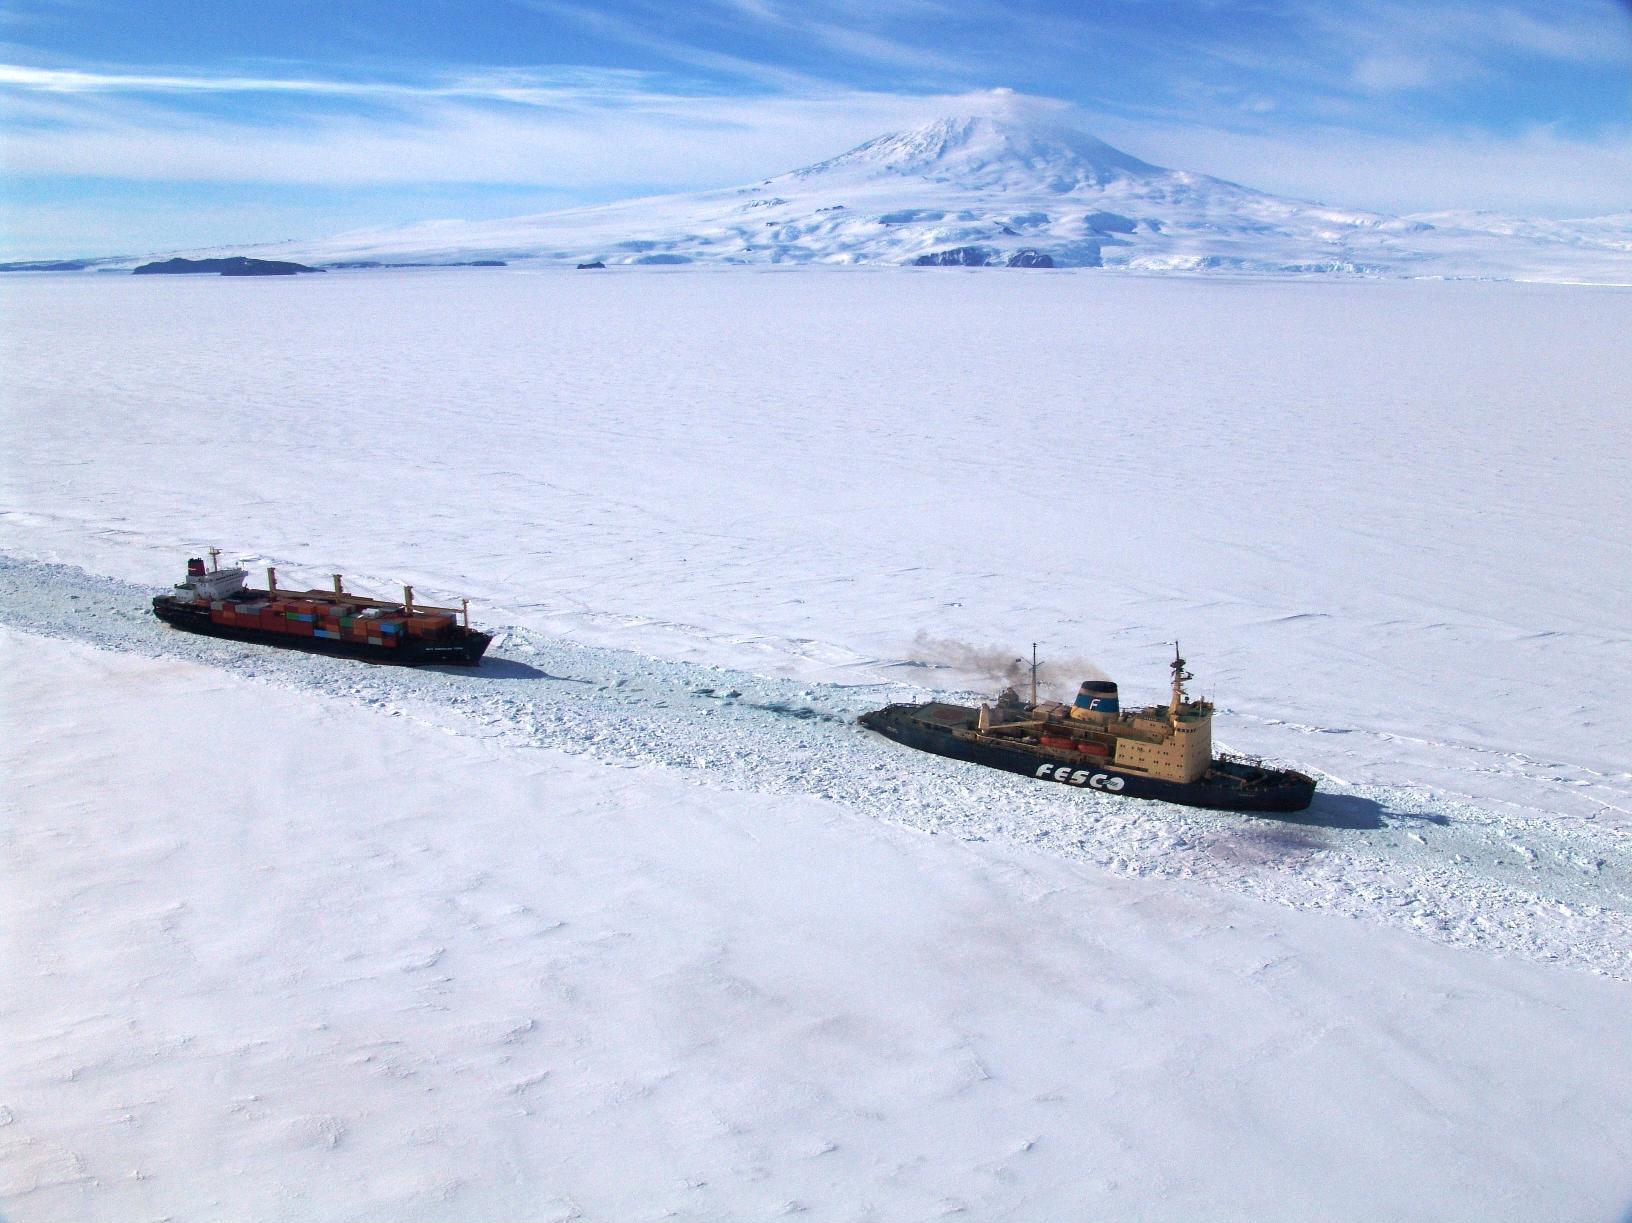
Russian icebreaker leading an American container ship to McMurdo Station on Ross Island, during Operation Deep Freeze 2006. Mount Erebus is in the background. Courtesy of Wikipedia.
Located on Ross Island, on the shore of McMurdo Sound, McMurdo Station is a US Antarctic research station at 78 °S. Ross Island is home to about half a million Adélie Penguins and one active volcano, Mount Erebus. The largest community in Antarctica, McMurdo Station is capable of supporting up to 1,258 people. The population in summer is around 1,100, while in winter it is less than 200. McMurdo is 2,200 miles due south of New Zealand.
A few more facts about McMurdo Station (weather data from Antarctic Connection):
- Time zone: New Zealand Standard Time (UTC+12) or New Zealand Daylight Time (UTC+13)
- Elevation: 78 feet above mean sea level
- Climate zone: Polar desert
- Average high temperature: 7 °F (-13 °C)
- Average low temperature: -5 °F (-20 °C)
- Record high temperature: 49 °F (9 °C)
- Record low temperature: -59 °F (-50 °C)
- Average annual precipitation (liquid water equivalent of the snow): 7.5 inches (190 mm)
Current weather: Currently it is winter in the Southern Hemisphere, although spring is on its way. The temperature at McMurdo right now is -6 °F, with light snow falling. The sun has just risen. Weather Underground says the sun rises as 10:37 am NZST today and will set at 3:16 pm. Tomorrow will be 22 minutes longer.
McMurdo, unlike Amundsen-Scott, which I described a couple of months ago, is not in the middle of a continent of ice at over 9,000 feet high. Weather extremes are not quite as bad as at the South Pole, and the temperature gets a little warmer. However, once the sun sets in the winter, and Ross Island becomes connected to the continent by ice, temperatures can plummet.
Most of this week will be clear with highs between -5 and -11 °F and lows between -31 and -40 °F (over 50 °F below next week!).
You can see the current and forecast weather at McMurdo on the Weather Underground page here.
For more information on McMurdo, here’s a link to Wikipedia. For information on Ross Island, here’s another link to Wikipedia.
Next Tuesday we’ll be back to looking at the weather and climate in another part of the globe. As always, if you have any comments or suggestions for future cities, please leave a comment on this post!
Permalink
08.17.10
Posted in Non-US Weather, Weather News at 2:21 pm by Rebekah
This week’s post in the global weather and climate series features Suva, Fiji.
-
-
-
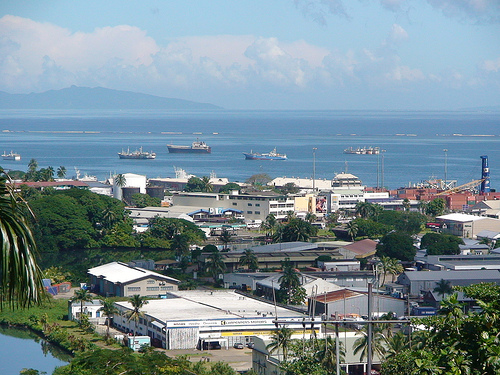
Walu Bay Industrial Zone, Suva City, Fiji. Courtesy of Wikipedia.
Last week we took a look at the weather and climate on the Galápagos Islands, in the east central Pacific Ocean. Today we’ll contrast that with the weather and climate of Fiji, in the south west Pacific Ocean.
The Republic of the Fiji Islands are an archipelago of over 332 islands and over 500 islets, amounting to over 7000 mi² of land. Fiji’s population is 849,000, but 87% of the people live on the two largest islands, Viti Levu and Vanua Levu. Fiji is located about 1200 miles northeast of New Zealand’s North Island. The islands are mountainous, with peaks over 4000 feet. Dependent on tourism and sugar exports, Fiji is also a producer of timber, fish, gold, copper, and oil.
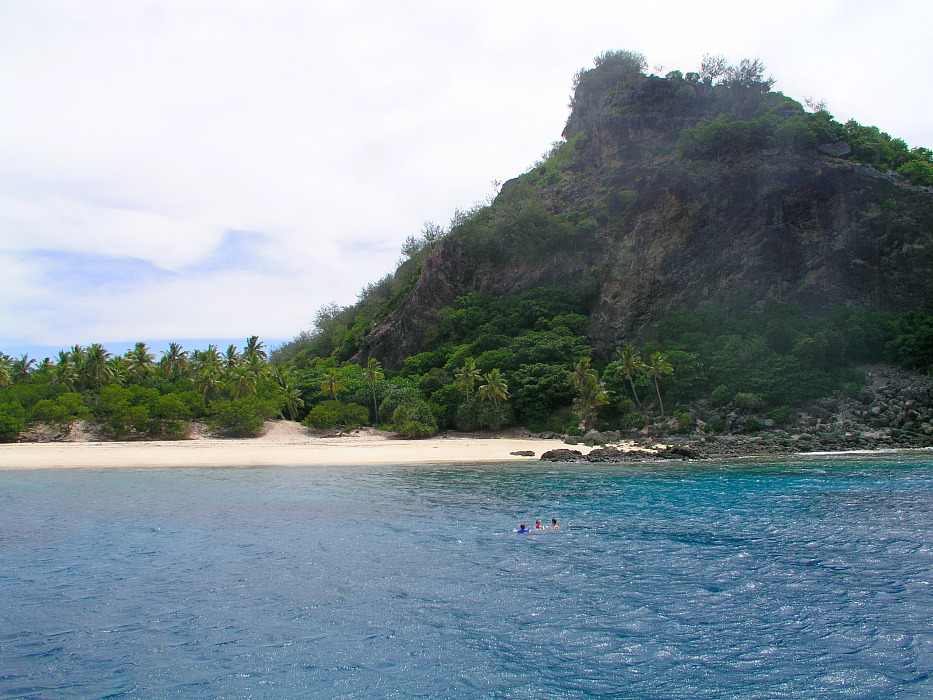
Monuriki Island, Mamanuca archipelago, Fiji. Courtesy of Wikipedia.
Suva is the capital of Fiji, found on the island of Viti Levu. Also the largest city in Fiji and in the South Pacific, Suva is home to nearly 86,000 people (over 172,000 in the metro). Suva is situated on a peninsula and has mountains to the north and west, allowing the southeast trade winds to produce rain year round.
A few more facts about Suva (courtesy of Wikipedia):
- Time zone: Fiji Standard Time (UTC+12)
- Elevation: 0 to 25 ft above mean sea level
- Climate zone: Tropical rainforest
- Average high temperature: 84 °F (29 °C)
- Average low temperature: 68 °F (20 °C)
- Record high temperature: 99 °F (37 °C)
- Record low temperature: 55 °F (13 °C)
- Average annual precipitation: 117 inches (2,980 mm)
Like Puerto Ayora in the Galápagos Islands, temperature only varies by a few degrees throughout the year in Suva. The average high in Suva is only a few degrees above the average high in Puerto Ayora, and the average lows of both cities are the same.
Also like Puerto Ayora, Suva tends to be warmer and wetter from December to May and cooler and drier from June to November.
However, unlike Puerto Ayora, Suva receives copious rainfall; in fact, Suva receives about 13 times as much rain as Puerto Ayora!
Both cities are located on the coast of an island in the tropical Pacific (Suva is at about 18°S, while Puerto Ayora is nearly on the equator), but the big difference comes in the location of each island.
The western Pacific receives more rain than the eastern Pacific for numerous reasons, including more hurricanes in the western Pacific and prevailing wind direction. Easterly trade winds push warm water (and warm, moist air) towards the west, while cold water wells up from beneath the surface (to replace the surface water that’s been pushed west) on the west tropical coast of South America. Water temperature greatly affects air temperature in the tropics, so temperatures will tend to be a little cooler (and air drier) on the eastern edge of an ocean basin and vice versa on the western edge. As mentioned above, Suva is also moist because it is on the southeast coast with mountains to the north and west, so the southeast trade winds bring moisture right into the area. The northwest coasts of Fiji islands are much drier.
Current weather: Rain showers, with highs in the mid-80s and lows near 70 °F.
For more information on Suva, here’s a link to Wikipedia. For more information on Fiji, here’s another link to Wikipedia.
For weather maps and information on current and forecast Fiji weather, see the Fiji Meteorological Service (check out their hand-drawn weather maps), WeatherZone (Australian weather site with weather info for all over the world) and Weather Online UK (collection of maps and weather information for all over the world).
Next Tuesday we’ll look at the weather in Antarctica. As always, if you have any comments or suggestions for future cities, please leave a comment on this post!
Permalink
08.10.10
Posted in Non-US Weather, Weather News at 5:02 pm by Rebekah
This week’s post in the global weather and climate series features Puerto Ayora, in the Galápagos Islands.
-
-
-
-
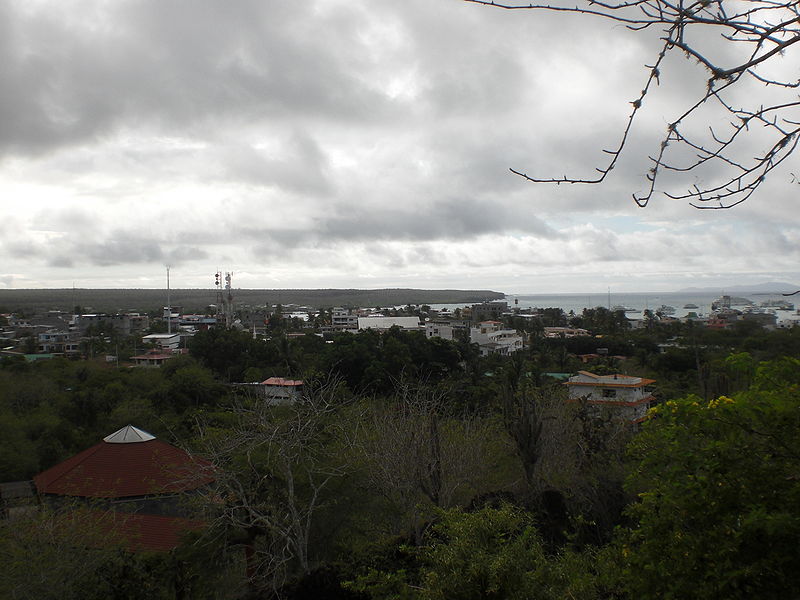
Puerto Ayora skyline. Courtesy of Wikipedia.
The Galápagos Islands are an archipelago of 18 volcanic islands that are governed by the country of Ecuador, located about 600 miles to the east. Situated on and near the equator, the Galápagos Islands are known for their wide variety of animals. The islands were discovered by the Spanish in the early 16th century, but until the early 19th century, they were frequently used as hideouts by English pirates who preyed on Spanish ships carrying riches from South America to Spain. The Galápagos Islands are also famous for being the study area of Charles Darwin, who sailed there on the HMS Beagle in 1835.
On the southeastern coast of Santa Cruz Island, Puerto Ayora is the largest city in the Galápagos Islands. Puerto Ayora is home to about 18,000 people (there are about 23,000 in the entire island chain) as well as the Charles Darwin Research Station, a biological research station focused on conservation of the Galápagos Islands’ terrestrial and marine ecosystems.
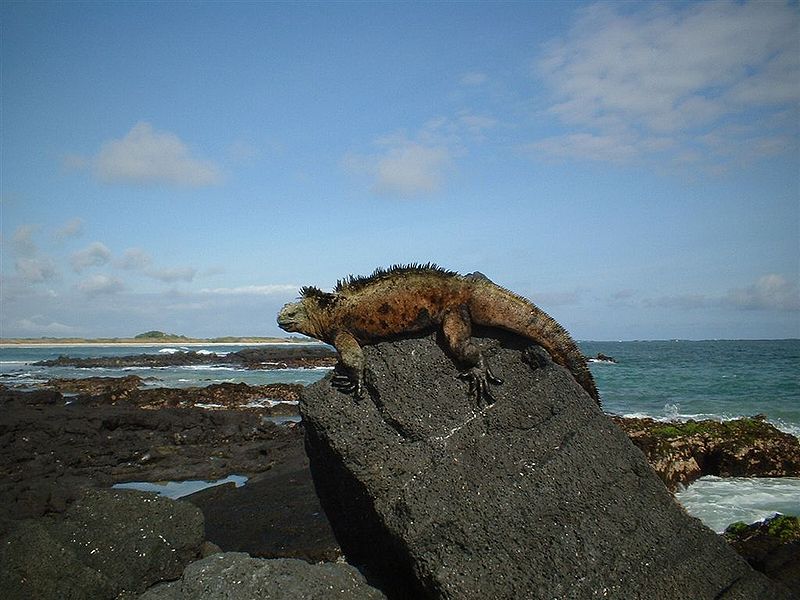
Marine iguana in the Galápagos Islands. Courtesy of Wikipedia.
A few more facts about Puerto Ayara (weather data from Eos Ecuador, averaged over the islands):
- Time zone: Galápagos Time (UTC-6)
- Elevation: 0 to 52 ft above mean sea level
- Climate zone: Tropical
- Average high temperature: 80 °F (27 °C)
- Average low temperature: 68 °F (20 °C)
- Average annual precipitation: 9 inches (230 mm)
Weather in the Galápagos Islands is warmer and wetter from January to June and cooler and drier from July to December. During El Niño, temperatures are warmer and rainfall is greater, while during La Niña, temperatures are cooler and rainfall is less.
Temperatures do not vary much on the islands, especially on the coastlines.
Current weather: Puerto Ayora is currently in the dry season, when any precipitation that does fall is generally in the form of drizzle. This week, Weather Underground is forecasting high temperatures from 69 to 71 °F and lows from 66 to 68 °F (not much variability, as the temperatures are primarily governed by the water temperature). Skies will usually be clear, with the exception of Wednesday and Friday, when there is a 20% chance for trace amounts of rain.
For more information on Puerto Ayora, here’s a link to Wikipedia. For more information on the Galápagos Islands, here’s another link to Wikipedia.
For weather maps and information on current and forecast Galápagos Islands and Ecuadorian weather, see the Instituto Nacional de Meteorología e Hidrología (Ecuador’s national weather service, in Spanish) and Weather Online UK (collection of maps and weather information for all over the world).
Next Tuesday I plan to take a look at the climate and weather in another part of the globe. As always, if you have any comments or suggestions for future cities, please leave a comment on this post!
Permalink
08.03.10
Posted in Non-US Weather, Weather News at 2:26 pm by Rebekah
This week’s post in the global weather and climate series features Peshawar, Pakistan.
-
-
-

Karkhano Market in Peshawar, Pakistan. Courtesy of Wikipedia.
Historically part of the old Silk Road, Peshawar is located on a floodplain on the Iranian plateau, near the eastern end of the Khyber Pass and near the Kabul River. Peshawar is in northwest Pakistan, about 30 miles east of the Afghan border and 100 miles west-northwest of Islamabad. One of the oldest cities in Asia, Peshawar has a long and rich history, as it has existed in some form for over 2000 years. Peshawar is the capital of the Khyber Pakhtunkhwa province in Pakistan and is home to about 3.1 million people.
A few more facts about Peshawar (from Wikipedia):
- Time zone: Pakistan Standard Time (UTC+5)
- Elevation: 1,673 ft above mean sea level
- Climate zone: Semi arid (very hot summers and mild winters)
- Average high temperature: 104 °F (40 °C)
- Average low temperature: 39 °F (4 °C)
- Average annual precipitation: 16 inches (400 mm)
Current weather: Pakistan is currently in the midst of a brutal monsoon season, with numerous floods affecting millions of people. Many people have lost their homes and up to 1,500 people have died as a result of the floods. Peshawar is not in a monsoon region, but the area around this city has recently received record rainfall that has caused rivers to swell and flood the plains.
The following satellite image shows clouds, largely as a result of the Indian monsoon, sweeping up over Pakistan (highest cloud tops are in blues and purples; orange indicates no or very low clouds).
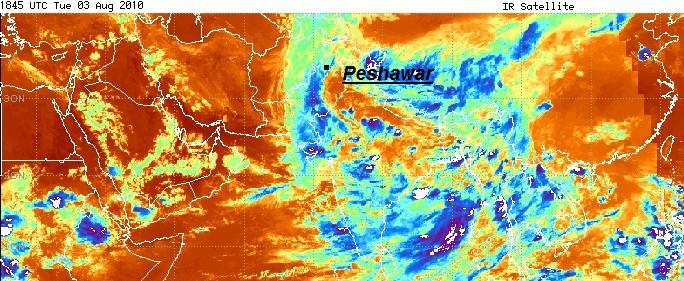
Infrared satellite image at 1845 UTC, showing Peshawar under clouds (click to enlarge). Satellite image from the Pakistan Meteorological Department.
Unfortunately, not much relief is in sight, as showers and thunderstorms are in the forecast for Peshawar all through this week into at least early next week. According to Weather Underground, Peshawar’s highs are expected to be in the low 100s and lows in the low 80s. The temperature on Friday is forecast to reach 109 °F, with a heat index of 114 °F.
For more information on Peshawar, here’s a link to Wikipedia.
For weather maps and information on current and forecast Pakistani weather, see the Pakistan Meteorological Department (Pakistan’s national weather service – it is in English!) and Weather Online UK (collection of maps and weather information for all over the world).
Next Tuesday I plan to take a look at the climate and weather in another part of the globe. As always, if you have any comments or suggestions for future cities, please leave a comment on this post!
Permalink
« Previous Page — « Previous entries « Previous Page · Next Page » Next entries » — Next Page »


