03.22.11
Posted in Non-US Weather, Weather News at 8:00 am by Rebekah
This week’s post in the global weather and climate series features Palma, Mallorca, in the Balearic Islands of Spain.
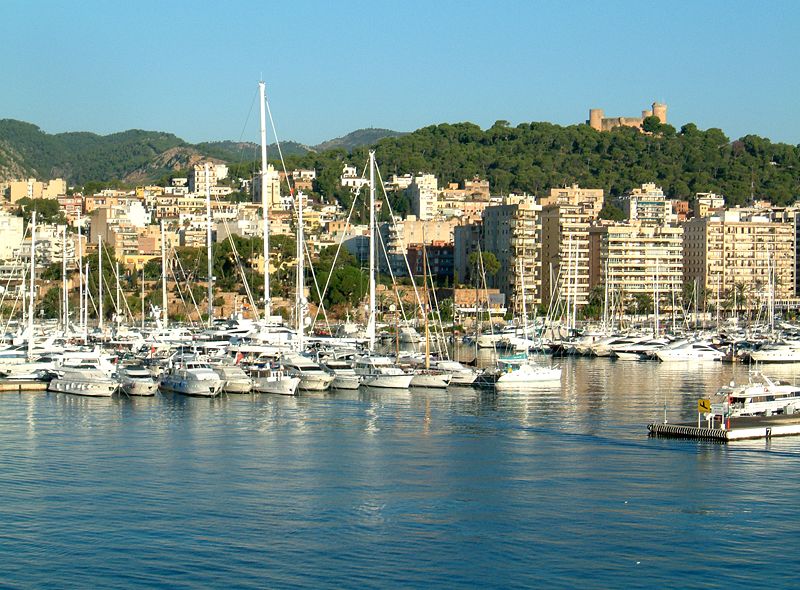
Harbor of Palma, with Bellver Castle in the background, from Wikipedia
The city of Palma was founded by the Romans back in 123 BC, so as you can imagine, the town (and the island) has gone through a long history, between the Romans, the Muslims, the Moors, the Vikings, the Spanish, etc.
Palma is situated on the southwest coast of the island of Mallorca (sometimes spelled Majorca). Mallorca is one of several islands belonging to the Balearic Islands, off the east coast of Spain in the Mediterranean. The Balearic Islands are part of Spain. Palma (also known as Palma de Mallorca), the capital of the Balearic Islands, is now home to about 401,270 people.
Tourism plays a large part in the economy of the islands; in 2010, over 6 million people came to visit tourist resorts on the island of Mallorca (according to Wikipedia). Mallorca is about 1,400 square miles in size (about 3,600 square km).
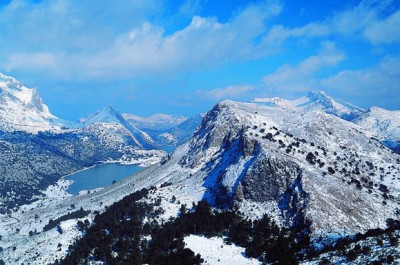
Serra de Tramuntana, a southwest-northeast mountain range on the northern coast of Mallorca; the highest point, Puig Major, is 4,741 ft tall (1,445 m). From Wikipedia
A few more facts about Palma (from Wikipedia):
- Time zone: Central European Time (UTC+1) or Central European Summer Time (UTC+2)
- Average elevation: 43 ft (13 m)
- Climate zone: Mediterranean (warm, dry summers; mild, wetter winters)
- Average high temperature: 71 °F (22 °C)
- Average low temperature: 58 °F (14 °C)
- Average annual high/low temperature range: 59 to 85 °F (15 to 30 °C) / 47 to 72 °F (8 to 22 °C)
- Average annual precipitation: 17 inches (427 mm)
Weather: June through August are the driest months of the year in Palma; every other month receives between 1 and 2.7 inches of precipitation. We are starting to go into the drier period, and temperatures are currently pretty seasonable.
Temperatures this week are expected to start out a little lower, with highs near 60 °F, but will rise up to 70 °F by Saturday. Lows this week will be in the mid-40s to near 50 °F.
There is a chance of rain today and tomorrow, but then it should dry up for the rest of the week. They have been getting a mostly east wind lately, as there is a rather large high pressure system sitting over Europe at present.
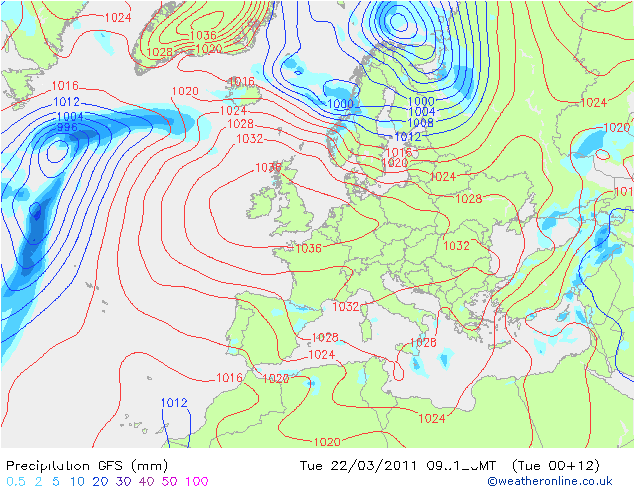
GFS model from 00Z run; valid for 12Z (1 pm local time). Map shows surface pressure and 3-hour precipitation. From Weather Online UK
For weather maps and information on current and forecast Palma, Mallorca, and Balearic Island weather, see the Agencia Estatal de Meteorología (Spain’s national weather service; good if you understand Spanish, though there is a semi-English version), Weather Underground and Weather Online UK (global maps and models).
For a bit more information on Palma, here’s a link to Wikipedia. Here is the city’s website (in Spanish).
Next Tuesday I plan to take a look at the climate and weather in another part of the globe. As always, if you have any suggestions for future cities, please leave a comment!
Permalink
03.16.11
Posted in Climate Change, Non-US Weather at 8:00 am by Rebekah
Last week I went to an interesting seminar in the National Weather Center, given by Dr. David Karoly of the University of Melbourne, titled “The recent extreme weather in eastern Australia: A sign of climate change or the response to La Niña?”
Dr. Karoly is from Australia, but spent several years as a meteorology professor at the University of Oklahoma. His specialty is climate, more specifically climate change, and he is on the Intergovernmental Panel on Climate Change (thus he shared in the Nobel Peace Prize awarded to the IPCC and former Vice President Al Gore in 2007). On a side note, when Dr. Karoly and his wife moved back to Melbourne a few years ago, they gave me their cat, Ginger, the one I still have today.
Anyway, today I thought I’d summarize and share some of the main points from the seminar.
—————————————
Extreme Weather Events in 2010/2011
- Heavy rain events in Queensland, Victoria, Northern Territory
- Flooding in eastern Australia
- Category 5 Tropical Cyclone Yasi hit the northeast Queensland coast
- Heat waves / bushfires in southwest Western Australia
- Heat waves / bushfires in Sydney in January
Toowoomba and Lockyer Valley Flash Floods, 10 – 12 January
- 30 people killed in floods following heavy rains on 10 January
- 1 day rainfall of 298 mm (11.7 inches) on 10 January in Peachester, Queensland
- 3 day (10 to 12 January) rainfall of 617 mm (24.3 inches) in Peachester
- Not the heaviest rainfall, though; 25 to 27 January 1974 had a 3 day total of over 1000 mm (39 inches)
Brisbane Floods, 13 January
- No loss of life
- Followed very heavy rain in the Brisbane River catchment from 10 to 12 January
- River flood peak of 4.46 m (14.6 ft)
- January 1974 flood peak was 5.6 m (18.4 ft), following 1 day rainfall of 600 mm (23.6 inches), 3 day rainfall of 314 mm (12.4 inches)
- This year, “only” 166 mm (6.5 inches) in one day in Brisbane, so most of the flooding was from rain/flooding upstream
Victorian Floods, 12 – 14 January
- Rain and flooding
- Very moist, tropical air arrived with a trough
- Record high precipitable water, 64.8 mm (2.6 inches), observed with the 11Z sounding in Melbourne on 13 January…in 40 years of observations, this was 20% higher than the previous sounding record
Summer Rainfall, 2010 – 2011
- Record summer rainfall in Victoria, 30% higher than the previous record
- Highest summer rainfall in Queensland, but it was still much higher in the summer of 1973 – 1974
Record Rain in Darwin, Northern Territory 15 – 17 February
- Less unusual to have heavy rain in Darwin, but slow-moving Tropical Cyclone Carlos was unusual
- 1 day rainfall record of 368 mm (14.5 inches) on 16 February in Darwin
Category 5 Tropical Cyclone Yasi
- 1 death attributed to Yasi, as a result of fumes from a diesel generator
- Very well forecast tropical cyclone
- Landfall around midnight on 3 February, near Innisfail and Cardwell, Queensland
- Weather station at Clump Point observed a minimum pressure of 929 mb at landfall
Southwest Western Australia Lack of Rainfall
- Very dry, below average rainfall
- Fires
Are these events due to greenhouse climate change or natural variability?
La Niña and Summer Rainfall
- La Niña was very high during the Australian summer; one of the strongest on record
- La Niña brings stronger trade winds, warmer seas around northeastern Australia, and higher rains to the northeastern Australian coast and Indonesia
- Australian summer was also warm in many parts of the country, including the west coast
- The heavy rains and floods of the Australian 1973 – 1974 summer also occurred during La Niña
Sea-Surface Temperatures (SSTs)
- December 2010 saw SSTs 20% warmer than any other year (in about 100 years) around not just the northeast coast, but much of Australia
- There has been a warming trend in December SST anomalies since 1900
Climate Change Signals
- The area getting heavy rain has been increasing
- Significant increase in warm nights agrees with models that show this amount of warming attributable to anthropogenic climate change
- It is believed that climate change has led to record high SSTs around Australia and higher moisture content, likely contributing factors to the increased rainfall
- HOWEVER, it’s too early to link precipitation to climate change models, as this is much more difficult and not statistically significant right now
- While Queensland landfalling tropical cyclones occur twice as often in La Niña years, there has been a marked decrease in severe landfalling tropical cyclones since 1870…this is in contrast to the IPCC claim that there should be an increase in severity on average everywhere…not sure why there is this discrepancy
—————————————
If you have any questions or comments, let me know! For some figures showing rainfall totals and anomalies across Australia, I refer you to a previous post I made, The Big Wet.
Permalink
03.15.11
Posted in Non-US Weather, Weather News at 8:00 am by Rebekah
This week’s post in the global weather and climate series features Sendai, Japan, one of the hardest-hit cities by last week’s 9.0 earthquake and ensuing tsunami.

Montage of Sendai, from Wikipedia
Founded in 1600, Sendai, known also by its nickname “The City of Trees”, is the capital of Miyagi Prefecture in Japan. The city is situated on the northeastern coast of Japan’s largest island, Honshu, and stretches from the Pacific Ocean to the Ōu Mountains. The highest point in the city is Mount Funagata (about 4,950 feet, or 1,500 meters tall). Sendai has a population of just over 1 million.
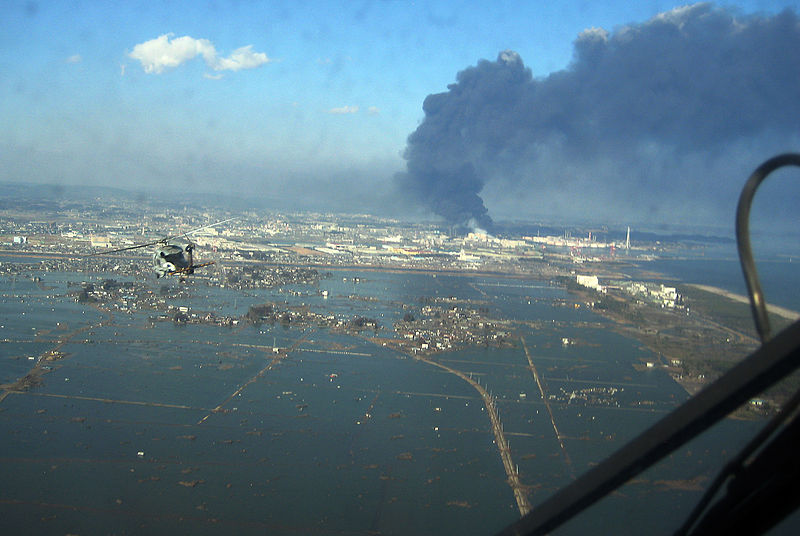
On Friday, March 11, a 9.0-magnitude earthquake and a tsunami of up to 33 feet (10 meters) tragically affected Sendai and many nearby cities. The following image, from Wikipedia (taken by the U.S. Navy), shows Sendai after the tsunami.
A few more facts about Sendai (from Wikipedia):
- Time zone: Japan Standard Time (UTC+9)
- Elevation: near sea level, but hilly
- Climate zone: Humid subtropical (cool, relatively dry winters and warm, wet summers)
- Average high temperature: 61 °F (16 °C)
- Average low temperature: 47 °F (9 °C)
- Average annual high/low temperature range: 41 to 82 °F (5 to 28 °C) / 28 to 70 °F (-2 to 21 °C)
- Average annual precipitation: 49 inches (1,242 mm)
- Average annual snowfall: 35 inches (90 cm)
Weather: The weather station in Sendai, located at Sendai Airport, stopped reporting as soon as the tsunami struck it, presumably damaging or destroying the instruments if not carrying them away. That being said, temperatures in the area have been fairly cool and typical for this time of year.
Currently, the primary surface feature near Japan is a surface low sitting off the east coast of the country, and this low will rapidly strengthen as it moves to the northeast.
Highs in Sendai this week will be around 40 °F until Saturday, when the temperature is expected to warm up to the mid-50s. Lows will range from the mid-20s to near 30 °F. There is a slight chance of some rain and snow almost every day and night this week (the greatest chance for snow is tonight).
Please keep the people of Japan and everyone affected by the recent disaster in your thoughts and prayers, including the aid workers and those working tirelessly and bravely to keep the nuclear damage at a minimum.
For weather maps and information on current and forecast Sendai weather, see the Japan Meteorological Agency, Weather Underground and Weather Online UK (maps and models).
For a bit more information on Sendai, here’s a link to Wikipedia
Next Tuesday I plan to take a look at the climate and weather in another part of the globe. As always, if you have any suggestions for future cities, please leave a comment!
Permalink
03.01.11
Posted in Non-US Weather, Weather News at 8:00 am by Rebekah
This week’s post in the global weather and climate series features Tripoli, Libya.
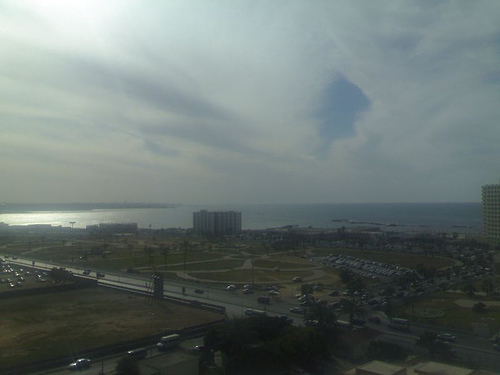
Looking over Tripoli to the Mediterranean. From Wikipedia
Tripoli is situated in the northwest part of Libya, on the Mediterranean Coast and the edge of the desert. Founded by the Phoenicians in the 7th century BC, Tripoli has had a long and rich history, between at least the Phoenicians, Greeks, Romans, Spanish, Turks, and Italians.
Today, the Tripoli metro area is home to 1,065,405 people (as of 2006). The capital of and largest city in Libya, Tripoli has been ground zero for the protests and revolts against the government and the leader of the country, Gadhafi. Tripoli is also the largest commercial and manufacturing center in Libya.
A few more facts about Tripoli (from Wikipedia):
- Time zone: Eastern European Time (UTC+2)
- Average elevation: 266 ft (81 m)
- Climate zone: Mediterranean
- Average high temperature: 78 °F (25 °C)
- Average low temperature: 60 °F (16 °C)
- Average annual high/low temperature range: 64 to 91 °F (18 to 33 °C) / 48 to 73 °F (9 to 23 °C)
- Average annual precipitation: 13 inches (334 mm)
Weather: Tripoli’s climate is Mediterranean, meaning it has warm, dry summers and cool winters with modest rainfall. This week Tripoli’s highs are in the low to mid-60s with lows in the mid- to upper 40s.
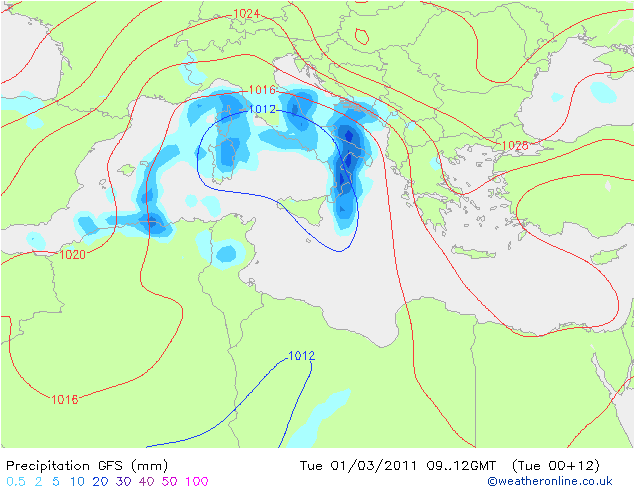
GFS forecast map for 1200 UTC today, showing low surface pressure over Italy, north of Libya (the filled contours indicate 3-hour precipitation). From Weather Online UK
For weather maps and information on current and forecast Tripoli weather, see Weather Underground and Weather Online UK (maps and models).
For more information on Tripoli, here’s a link to Wikipedia.
Next Tuesday I plan to take a look at the climate and weather in another part of the globe. As always, if you have any suggestions for future cities, please leave a comment!
Permalink
02.22.11
Posted in Non-US Weather, Weather News at 8:00 am by Rebekah
This week’s post in the global weather and climate series features Manaus, Amazonas, Brazil.
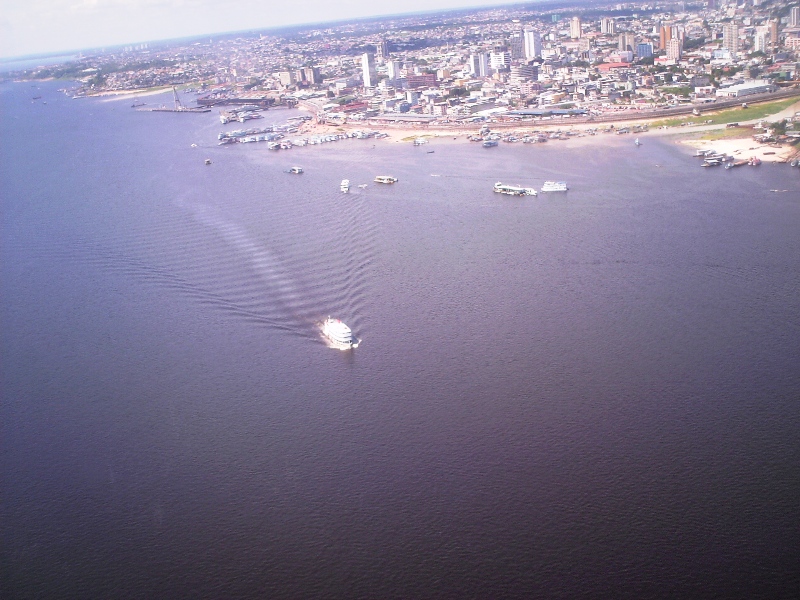
Aerial view of Manaus, looking over the Rio Negro. From Wikipedia
Manaus is a city of over 1.7 million people (over 2 million in the metro), lying at the confluence of the Negro and Amazon rivers. The capital of the Brazilian state of Amazonas, Manaus is located in the heart of the Amazon Rainforest and is a popular ecotourist destination. Manaus makes up 50% of the population of the Amazon.
Manaus was founded as a fort in 1669, to help establish the Portuguese claim on the area. In the late 19th century, Manaus was at the center of the rubber boom of the Amazon. Current exports include timber and Brazil nuts, while petroleum refining, soap manufacturing, shipbuilding, chemical industries, and tourism are also a part of the economy.
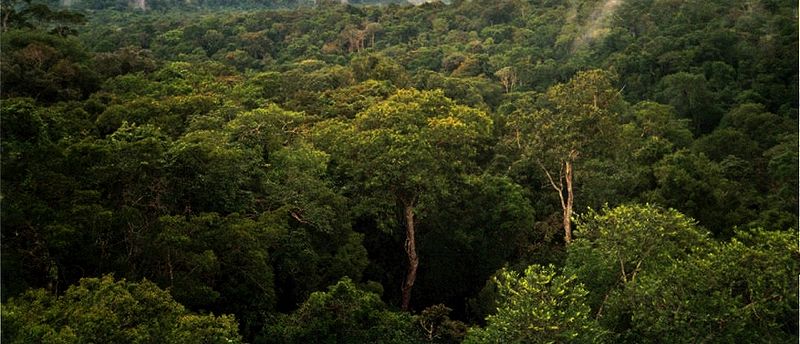
Amazon Rainforest, on the north side of Manaus. From Wikipedia
A few more facts about Manaus (from Wikipedia):
- Time zone: Atlantic Standard Time (UTC-4)
- Average elevation: 302 ft (92 m)
- Climate zone: Tropical rainforest
- Average high temperature: 86 °F (30 °C)
- Average low temperature: 73 °F (23 °C)
- Average annual high/low temperature range: 86 to 90 °F (30 to 32 °C) / 73 to 75 °F (23 to 24 °C)
- Record high temperature: 99 °F (37 °C)
- Record low temperature: 55 °F (13 °C)
- Average annual precipitation: 66 inches (1,670 mm)
Weather: As Manaus is situated at just 3 °S and in the middle of a rainforest, the climate is pretty steady year-round. As you can see by the climate stats above, the temperature really doesn’t range outside of the low to mid-70s at night to the upper 80s during the day. Makes for an easy forecast! There is a distinct rainy season, though; the wettest months are December through May.
This week the forecast is calling for…you guessed it, lows around 73 °F and highs around 84 °F, with a chance of rain every day.
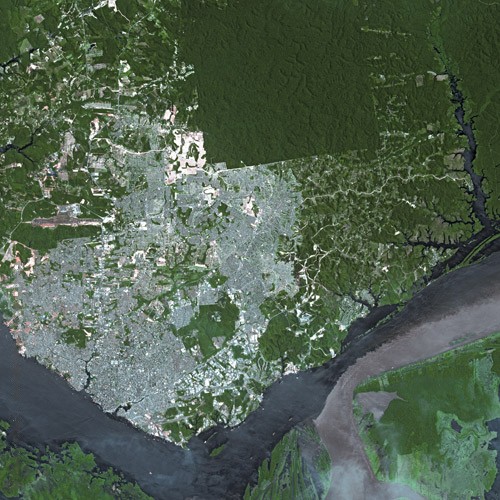
Satellite view of Manaus, showing the Rio Negro (left) flowing into the Amazon River (going off to the right). From Wikipedia
For weather maps and information on current and forecast Manaus weather, see Weather Underground and Weather Online UK (maps and models).
For more information on Manaus, here’s a link to Wikipedia.
Next Tuesday I plan to take a look at the climate and weather in another part of the globe. As always, if you have any suggestions for future cities, please leave a comment!
Permalink
« Previous Page — « Previous entries « Previous Page · Next Page » Next entries » — Next Page »


