02.10.11
Posted in Non-US Weather, Tropical Weather, Weather News at 4:14 pm by Rebekah
Parts of Australia have been flooding for the past couple of months now. With even more rainfall following Tropical Cyclone Yasi’s landfall last week, how is the country doing lately in terms of rainfall amounts and river heights?
February 3 – February 10 rainfall totals (Bureau of Meteorology)
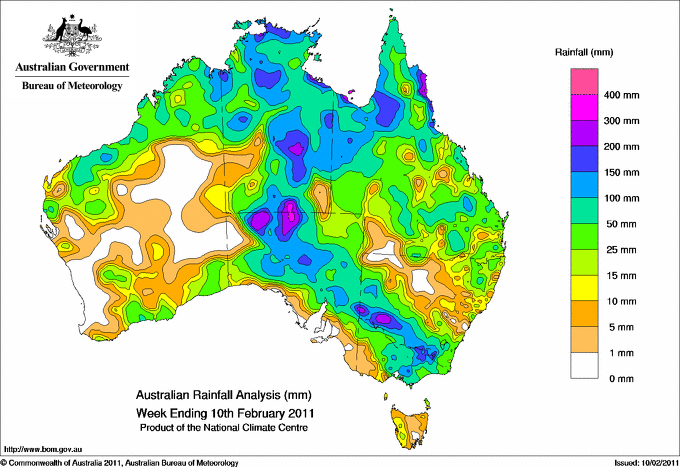
The biggest thing that pops out at me from this map is the swath of higher rainfall from northern Queensland southwestward to the south central part of the Northern Territory, as a result of Tropical Cyclone Yasi, as well as the swath of rain from north central South Australia southeastward through northern Victoria / southern New South Wales, as a result of a trough of low pressure.
Current river conditions (Bureau of Meteorology)
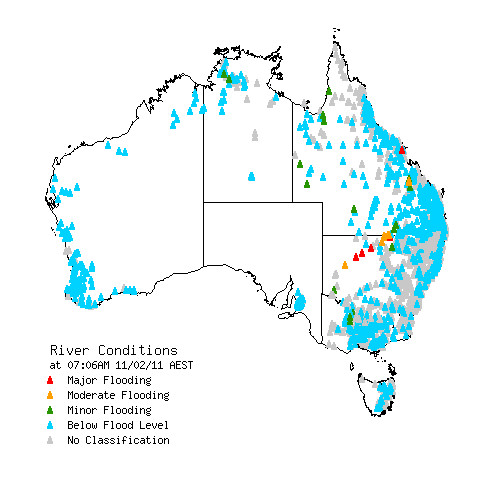
This map is better than those from a few weeks ago (see below); most of the rivers are below flood level now, with the exception of a few in Queensland and New South Wales.
November 26 – January 20 peak river conditions (Bureau of Meteorology)
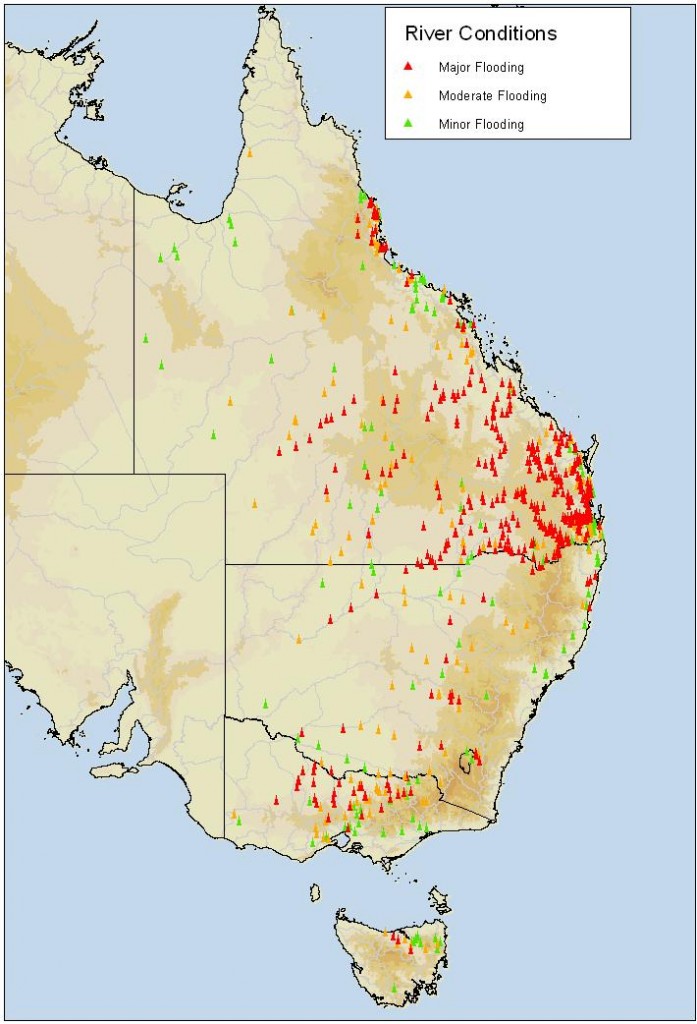
Now for a look at some rainfall maps from over the past three months…
November 1 – January 31 rainfall totals (Bureau of Meteorology)
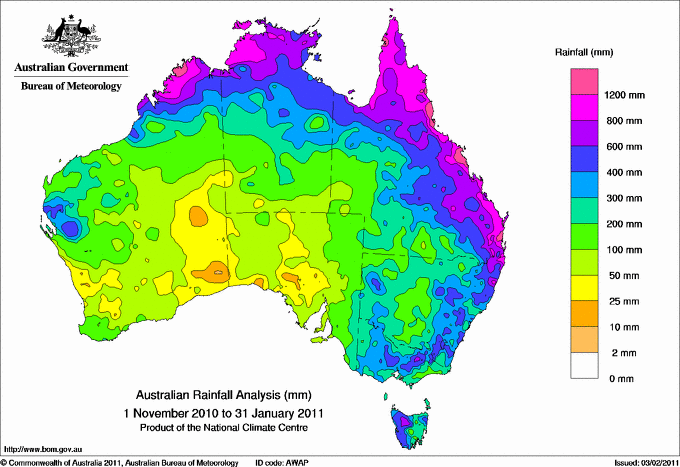
November 1 – January 31 rainfall anomalies (Bureau of Meteorology)
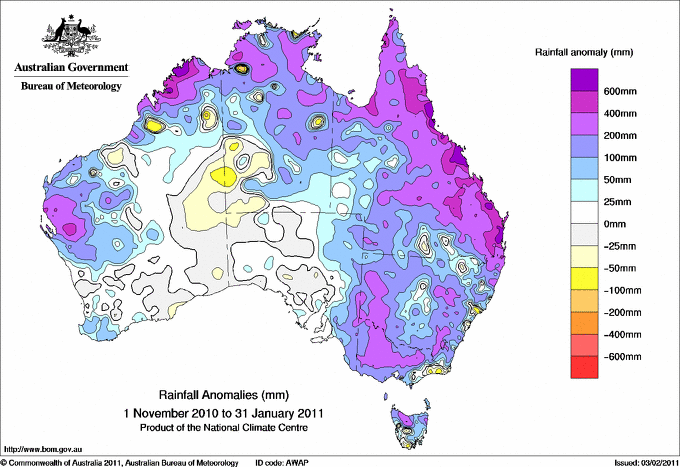
Wow, many coastal areas received well above average rainfall! Now how does this rainfall compare to the average rainfall?
November 1 – January 31 rainfall percentages (Bureau of Meteorology)
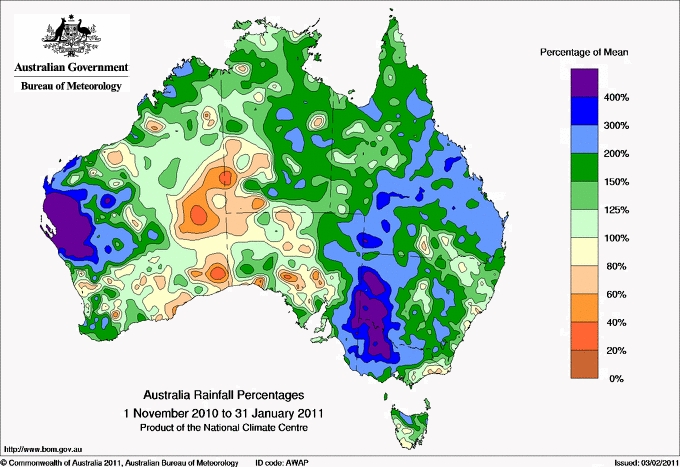
Okay, so most of eastern Australia experienced above average rainfall from November through January. More specifically, western New South Wales and Victoria had well above average rainfall, as well as the west central coast of Western Australia.
Now how does this compare to the records?
November 1 – January 31 rainfall deciles/records (Bureau of Meteorology)
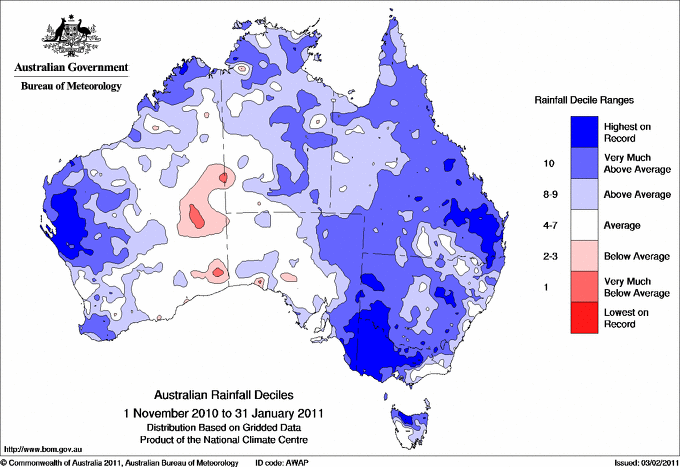
This map shows that the rainfall in most of eastern Australia was well above average…much of Victoria, western New South Wales, and southeastern Queensland broke all-time rainfall records. That’s a pretty large record-breaking area! Note also that the west central coast of Western Australia has also received the highest amount of rainfall on record.
Has the rain affected the temperatures much? Absolutely.
November 1 – January 31 mean temperature anomaly (Bureau of Meteorology)
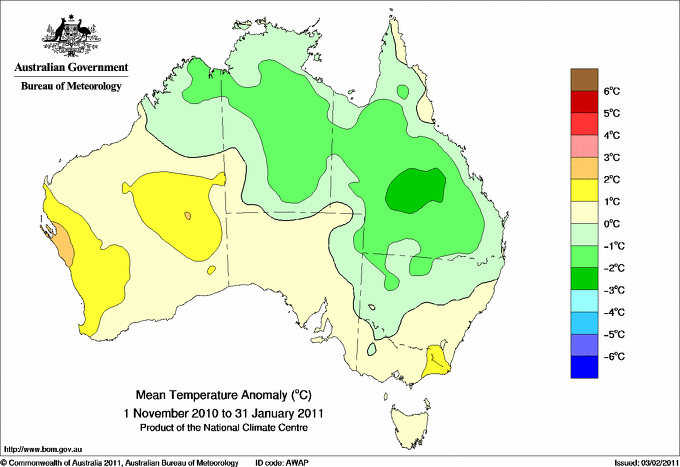
It’s not a coincidence that Queensland’s average temperatures were lower from November through January…the clouds and rain contributed quite a bit to the slightly cooler weather.
For more on Australia’s climate data, check out the following links from the Bureau of Meteorology: Queensland in January 2011: Widespread flooding continued; Special Climate Statement 24 [on frequent heavy rains in late 2010 / early 2011, PDF document]; and Severe Tropical Cyclone Yasi [maps and info]. To see more of the above maps, check out the links posted in the captions.
One more thing: models show another tropical cyclone could develop in the Gulf of Carpentaria next week (and make landfall) and another cyclone off the coast of Western Australia by next weekend (though it would move away).
Here’s a map from the BoM showing the average annual number of tropical cyclones around Australia (click to enlarge):
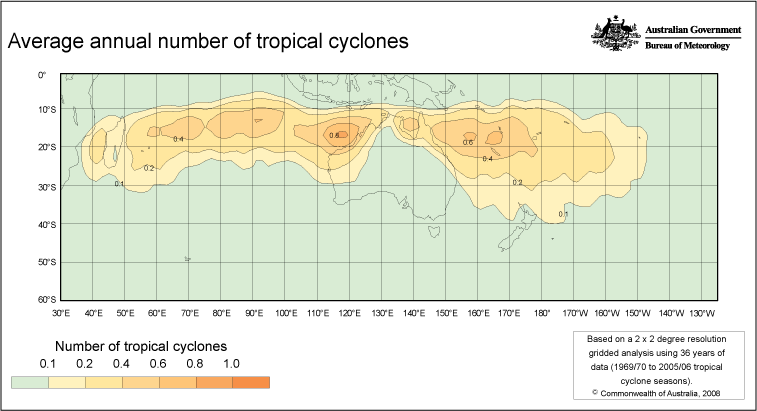
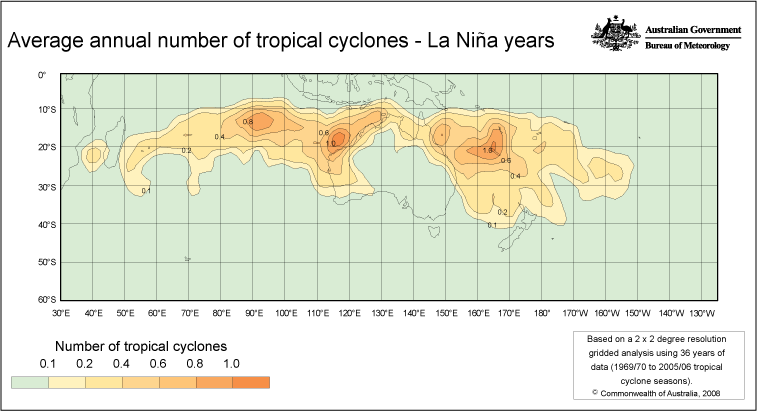
Compare that to a La Niña year, which we’re in now:
Stay tuned and stay safe!
Permalink
02.08.11
Posted in Non-US Weather, Weather News at 8:00 am by Rebekah
This week’s post in the global weather and climate series features Vancouver, British Columbia, Canada.
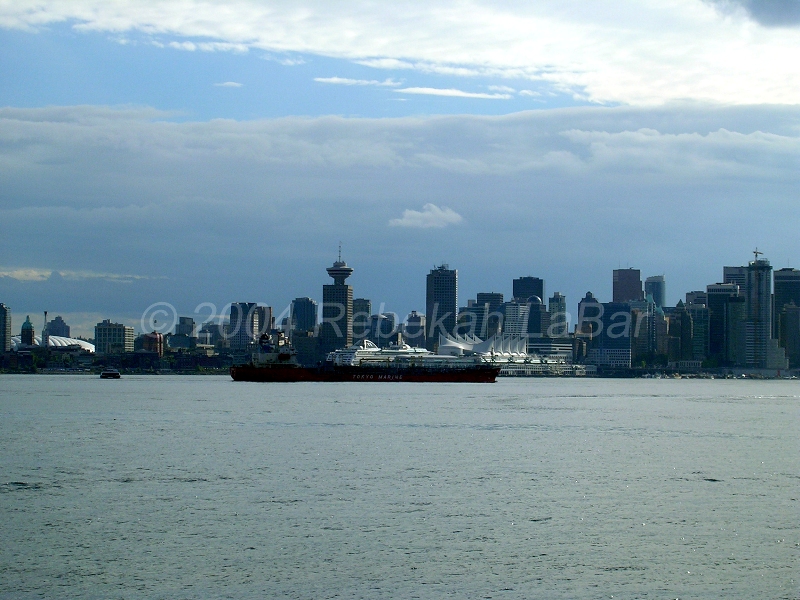
Vancouver, looking across the harbour from North Vancouver
Vancouver lies on the southwest coast of Canada, and with a metropolitan population (2006) of 2,116,581 (urban: 578,041), it is the most populous city in western Canada and the third largest in the country (in terms of the metro). Immigration has increased dramatically in recent years, and as many as 30% of the city’s population is of Chinese heritage (~52% of the city’s population does not speak English as their first language).
The primary industry of Vancouver is logging; in fact, the city began in the mid-1800s as a logging town. The port of Vancouver (Port Metro Vancouver) is also a vital part of the city, and is the fourth largest port (by tonnage) in North America, after South Louisiana, Houston, and New York/Newark. The second largest industry in Vancouver is tourism. Vancouver is also the third largest film-production center in North America, after Los Angeles and New York City. You may recognize the skyline of Vancouver in some TV shows and movies.
A few more facts about Vancouver (from Wikipedia):
- Time zone: Pacific Standard Time (UTC-8) or Pacific Daylight Time (UTC-7)
- Average elevation: 7 ft (2 m)
- Climate zone: Oceanic or marine west coast
- Average high temperature: 57 °F (14 °C)
- Average low temperature: 44 °F (7 °C)
- Average annual high/low temperature range: 43 to 71 °F (6 to 22 °C) / 33 to 56 °F (1 to 13 °C)
- Record high temperature: 94 °F (34 °C)
- Record low temperature: 0 °F (-18 °C)
- Average annual precipitation: 47 inches (1,199 mm)
- Average annual rainfall: 45 inches (1,155 mm)
- Average annual snowfall: 19 inches (48 cm)
Weather: In contrast to last year during the 2010 Winter Olympics, Vancouver has been seeing near average temperatures lately. January did bring above average rainfall, though, and that has been due in large part to an occasional stream of moisture from the central Pacific known as the Pineapple Express. The ridge in place over the eastern Pacific has been great for pulling the moisture northward into southwest Canada and the northwest U.S.
This mild, wet pattern is likely to continue for at least the next week or so.
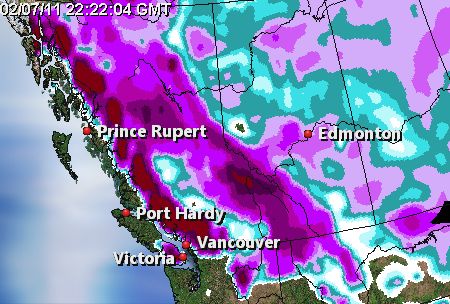
As far as snow, here’s a snow depth map for British Columbia from The Weather Network:

For weather maps and information on current and forecast Vancouver weather, see Environment Canada, Weather Underground, and The Weather Network.
For more information on Vancouver, here’s a link to Wikipedia.
Next Tuesday I plan to take a look at the climate and weather in another part of the globe. As always, if you have any suggestions for future cities, please leave a comment!
Permalink
02.05.11
Posted in Non-US Weather, Weather News at 8:00 am by Rebekah
Have you ever heard of the Pineapple Express?
The Pineapple Express is a term for a plume of moisture that originates around the east central Pacific (often near Hawaii) and travels up to the West Coast of the United States. This band of moisture is often responsible for heavy rain, snow, and/or flooding events from the Pacific Northwest to southern California.
Now, have you ever heard of the Rum Runner?
The Rum Runner is a similar moisture plume that runs from the eastern Caribbean up to western Europe. This atmospheric river of moisture is also responsible for many of the heavier rain and flooding events from Ireland and the United Kingdom to Spain.
Examples
The following map (click to enlarge), from Jason Cordeira’s website, shows global 250 mb heights (the “dips” in the northern hemisphere are troughs of low pressure, while the “mountains” are ridges of high pressure…the reverse is true for the southern hemisphere) and precipitable water (the amount of water that would be measured if all the moisture in the atmosphere at that point fell out as rain). The important part to note here is that the colors are showing moisture, and the bigger the number, the greater the moisture.
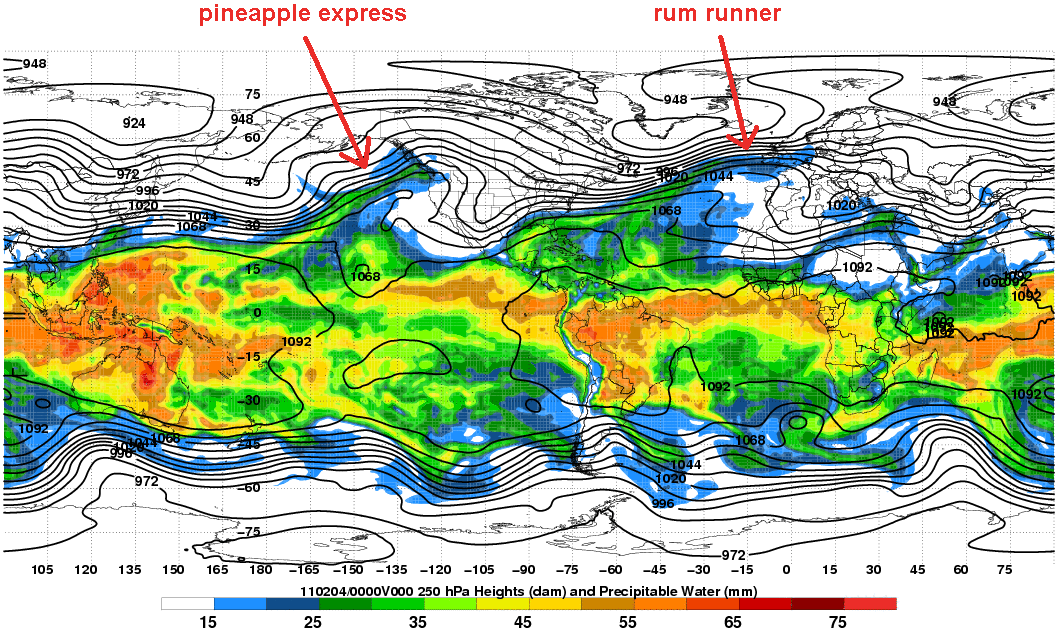
Note the plume of moisture being transported from the central Pacific up into British Columbia and Washington State…this is the Pineapple Express.
Note also the plume of moisture being transported from the western Atlantic up into Ireland and United Kingdom…this is the Rum Runner.
The infrared satellite image below, from the U.K. Met Office website, also shows evidence of the Rum Runner in the thin band of clouds that stretch across the image into southern Scandinavia.
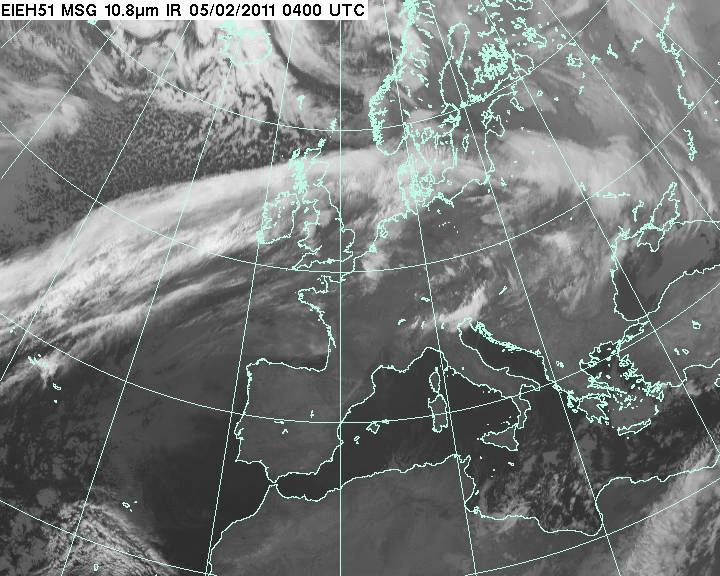
The Rum Runner is stronger when there is a strong westerly jet stream, as there is now. The stronger jet stream is a result of a stronger Icelandic Low and Azores High (for more on the North Atlantic Oscillation, see this blog post and this Wikipedia).
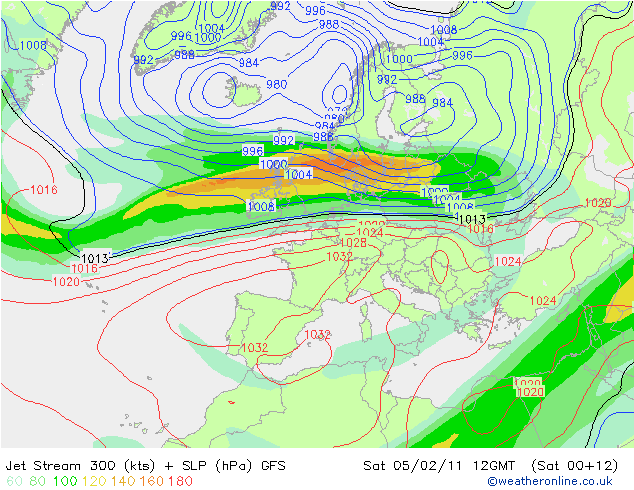
The above map shows surface pressure (contoured) and the 300-mb jet stream (filled colors), from Weather Online UK, for 12Z this morning. Note the low pressure over northern Europe and the high pressure over Spain, contributing to the higher wind speeds in the jet stream. This jet stream is transporting the deep plume of moisture into northern Europe (see also below, including precipitation).
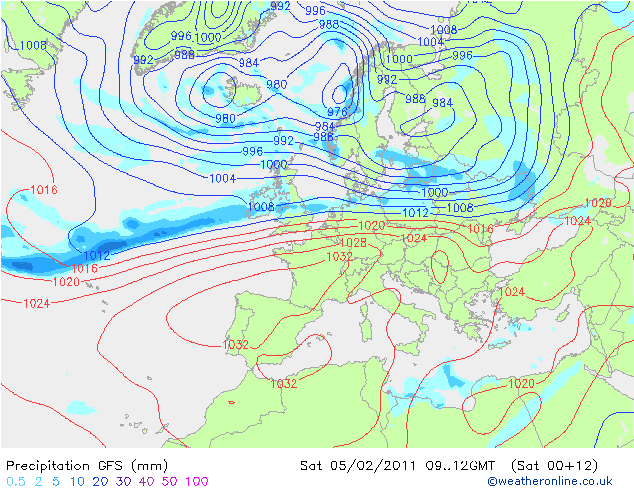
I recommend checking out the animation of the above precipitable water map, to get a better appreciation for how these atmospheric rivers move. It’s pretty cool, and can be found at the website of Jason Cordeira, student at SUNY Albany.
Permalink
02.02.11
Posted in Non-US Weather, Tropical Weather at 10:24 am by Rebekah
Category 5 Tropical Cyclone Yasi (equivalent of a Cat. 4 on the Saffir-Simpson scale) made landfall near Mission Beach, between Innisfail and Cardwell, Queensland about an hour and a half ago (12:30 am local time).
Here is a summary of the cyclone’s landfall and expected impacts.
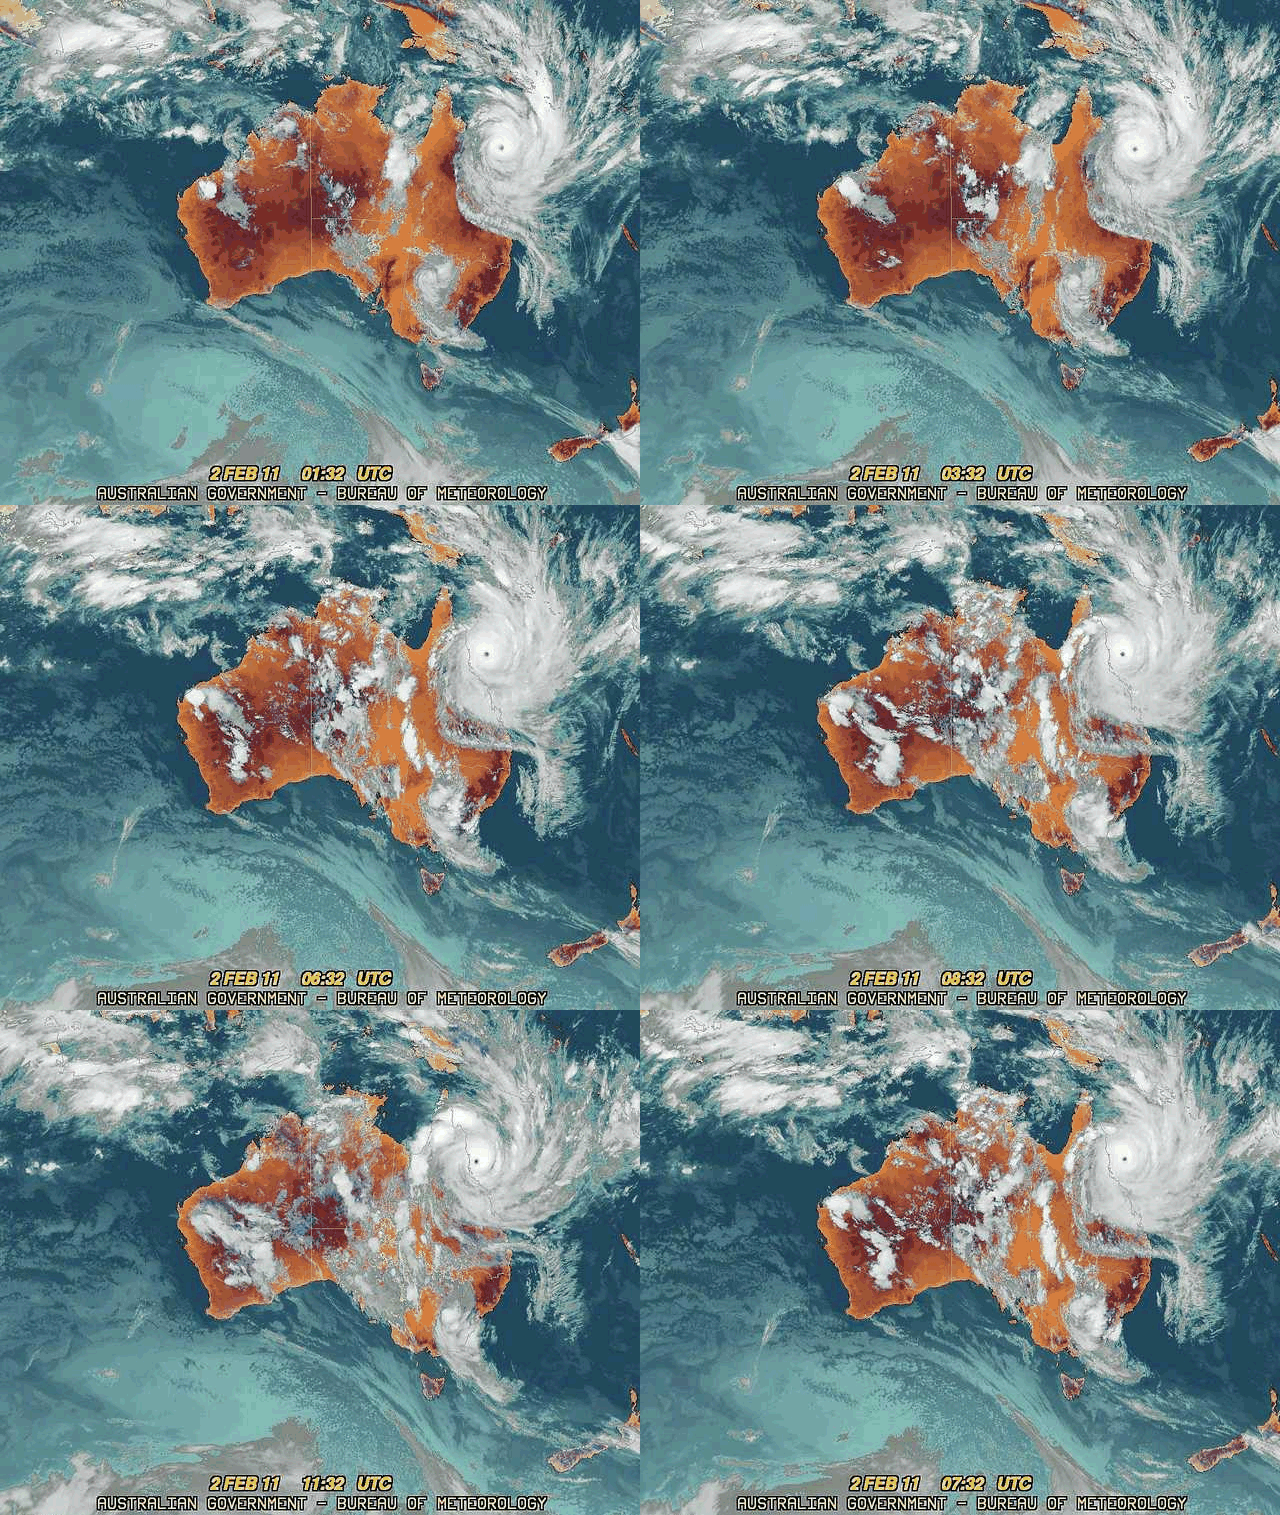
12-hr infrared satellite loop of Yasi nearing the Queensland Coast, from the Bureau of Meteorology (click to enlarge)
Stats around landfall:
- Maximum sustained 10-minute wind speed: 127 mph (202 kph)
- Maximum 3-second wind gust: 178 mph (285 kph)
- Central pressure: 930 mb
- Maximum storm surge: 30 ft (9 m)
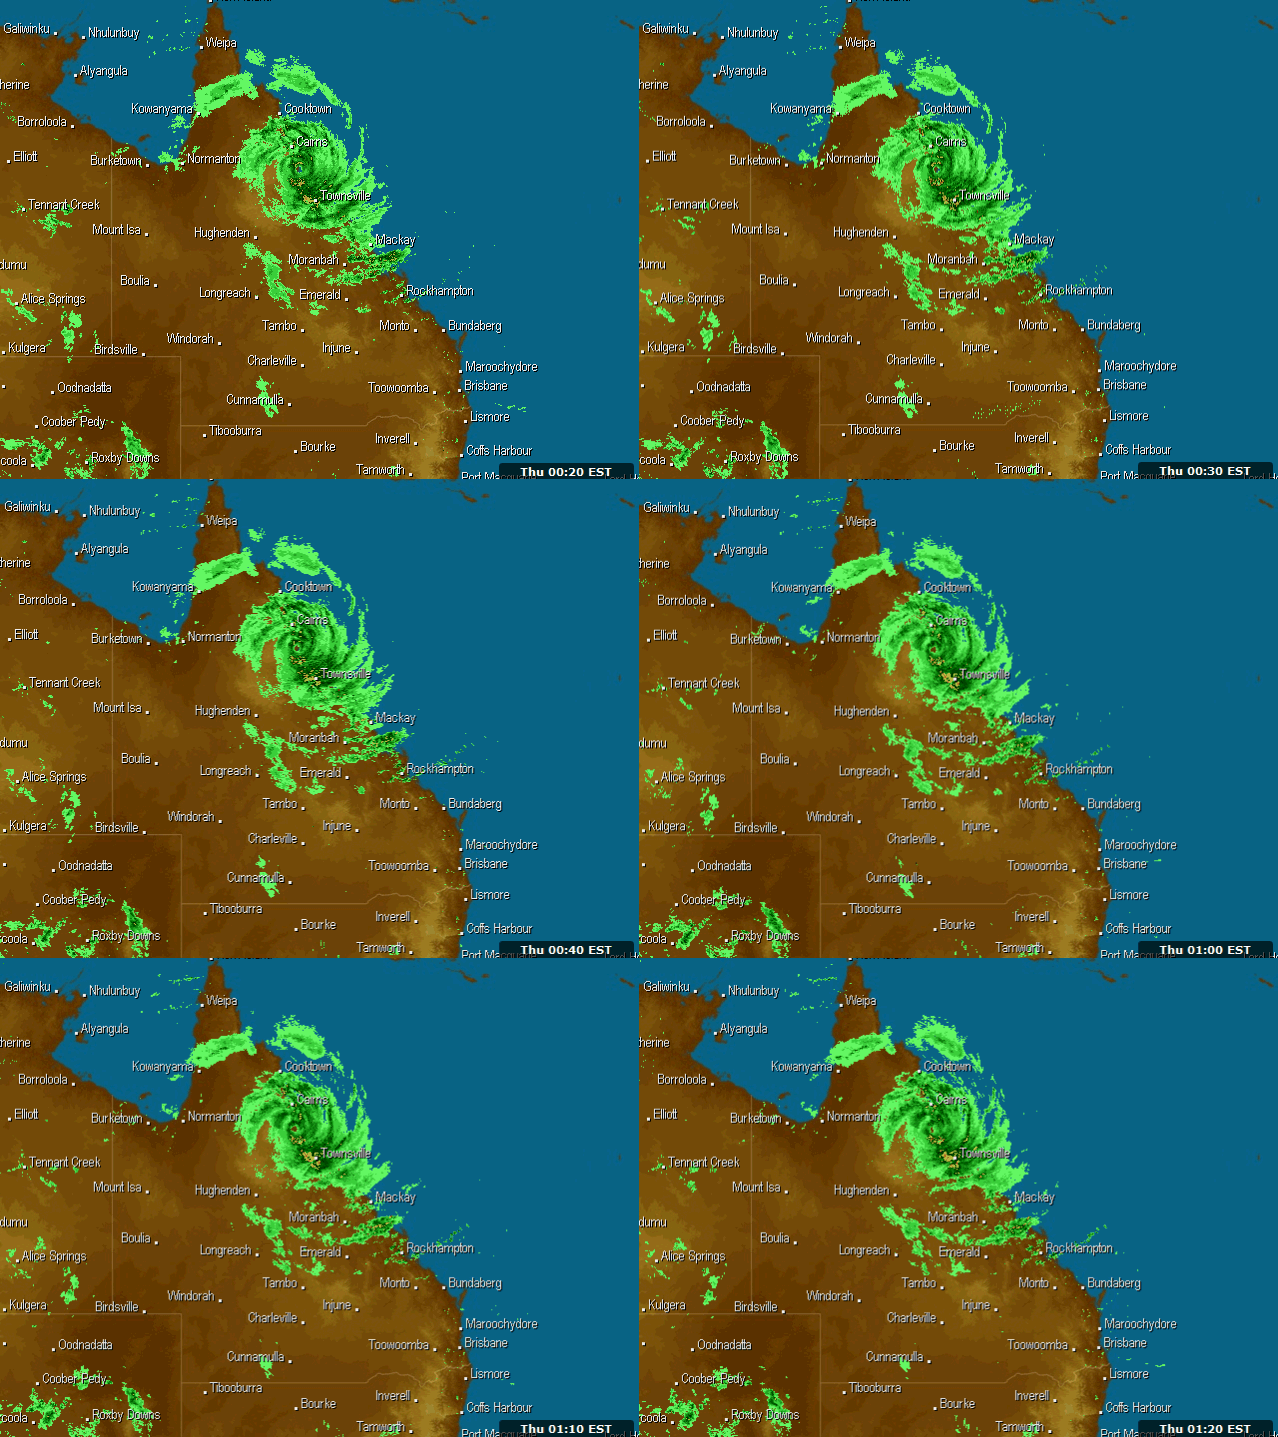
1-hr radar loop showing Yasi making landfall, from Weatherzone (click to enlarge)
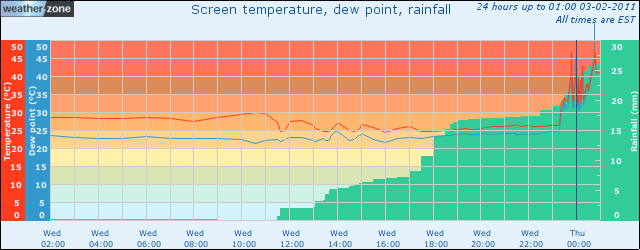
Meteogram (history of weather) for Lucinda Point over the last 24 hours, from Weatherzone…note the spike in temperature, dewpoint, and rain as the eye passes over (click to enlarge)
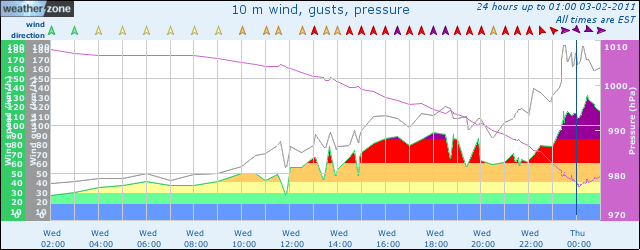
Meteogram for Lucinda Point over the last 24 hours, from Weatherzone…note the drop (and subsequent rise) in pressure and the peak in winds as the eye passes over…the lowest pressure recorded was 977 mb, the highest wind was 135 kph (84 mph), and the highest wind gust was 185 kph (116 mph) (click to enlarge)
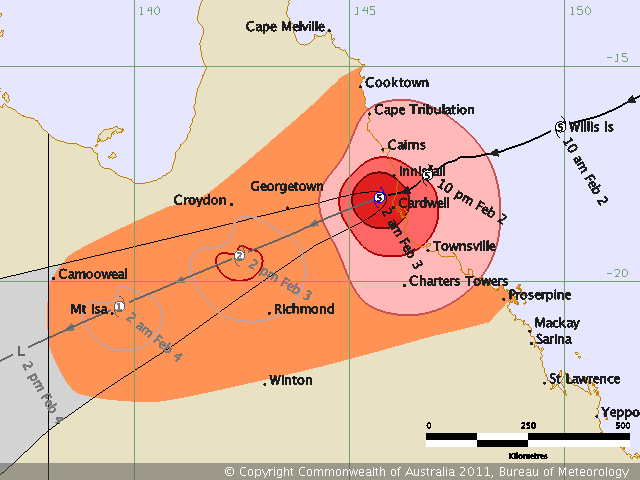
Latest forecast track and intensity for Yasi, as of 2 am local time, from the Bureau of Meteorology (click to enlarge)
Even once the winds slow down some, Yasi will bring a lot of rain to northeastern Queensland; the cyclone also looks like it will stall for a bit in the mountains, allowing even more rain to fall. Models show that the area could receive as much as a foot of rain, and some localized areas could even receive 2 feet or more of rain.
Permalink
02.01.11
Posted in Non-US Weather, Tropical Weather at 1:27 pm by Rebekah
Severe Tropical Cyclone Yasi is a Category 5 tropical cyclone this morning (Australian scale …Category 4 on the Saffir-Simpson scale).
The maximum sustained winds are 138 mph (221 kph), and the minimum central pressure is 924 mb. Yasi is moving towards the west-southwest at about 17 mph (28 kph).
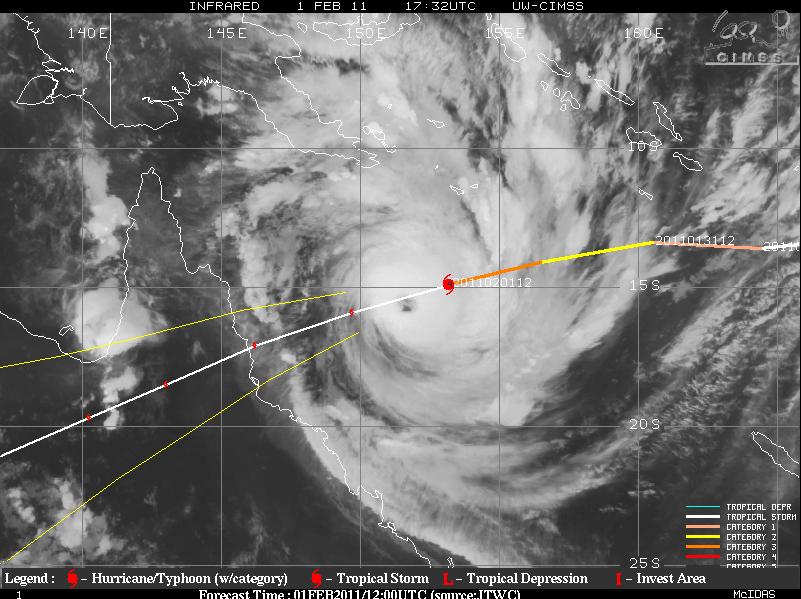
Yasi, at 1732 Z (3:32 am Australian EST), from UW-CIMSS (click to enlarge)
Yasi’s wind field is enormous, so don’t just focus on where the eye is headed…here’s some excerpts from the latest (5:01 am Australian EST) tropical cyclone advice from the Bureau of Meteorology:
“SEVERE TC YASI IS A LARGE AND VERY POWERFUL TROPICAL CYCLONE AND POSES AN EXTREMELY SERIOUS THREAT TO LIFE AND PROPERTY WITHIN THE WARNING AREA, ESPECIALLY BETWEEN PORT DOUGLAS AND TOWNSVILLE.”
“THIS IMPACT IS LIKELY TO BE MORE LIFE THREATENING THAN ANY EXPERIENCED DURING RECENT GENERATIONS.”
This is obviously some pretty strong wording, so if you are in the path of this cyclone, please take all warnings seriously, and find higher ground if you live near the sea. The storm surge is expected to be very high and some areas could get as much as 3 feet of rain, so there will be some flooding up and down the coast (and further inland, wherever the heaviest rains set up).
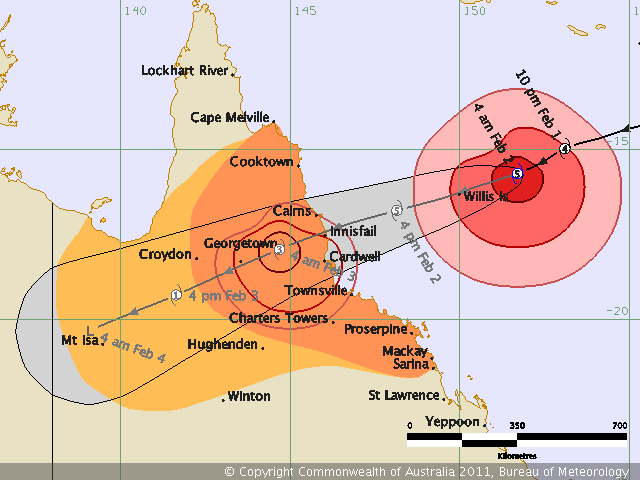
Yasi’s latest forecast track and intensity, from the Bureau of Meteorology (click to enlarge)
Permalink
« Previous Page — « Previous entries « Previous Page · Next Page » Next entries » — Next Page »


