04.06.11
Posted in Severe Weather Post-analysis at 8:00 am by Rebekah
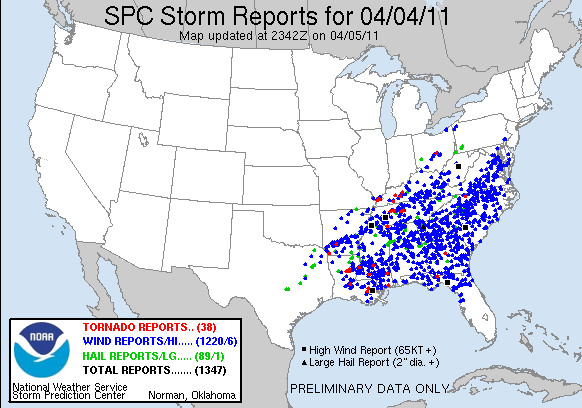
On Monday (into early Tuesday), the National Weather Service received 1,347 severe thunderstorm reports!
There were 38 tornado reports, a whopping 1,220 severe wind reports, and 89 severe hail reports.
This is the highest number of severe storm reports in 24 hours since 2000, according to The Weather Channel.
A few more facts from The Weather Channel:
-
Between 2000 and 2009, April has averaged 1,090 severe wind reports. Monday’s severe weather outbreak had more than this in one 24-hour period.
-
The 10-year average of all severe thunderstorm reports for the month of April is 3,402. Monday’s outbreak saw nearly 40% of this value.
-
The reports stretched across 19 states.
What an incredible event!
Permalink
03.19.11
Posted in Severe Weather Post-analysis, Weather News at 8:00 am by Rebekah
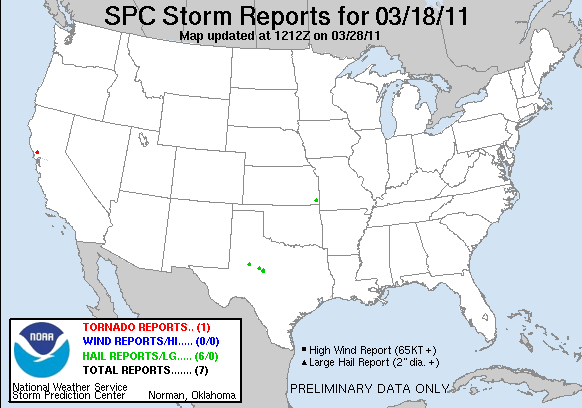
Yesterday morning a tornado or two touched down not far north of the San Francisco Bay.
The one storm report showing up right now on the Storm Prediction Center site is for a tornado at 1615Z (9:15 am Pacific Time) in Santa Rosa, California. The report said “EF1 tornado completely destroyed metal building and severely bent metal gate.”
I also heard that there may have been another tornado yesterday over the water, making it a waterspout.
While there were a few tornado-warned supercells around the Bay Area, the primary severe weather threat in the area was for high winds.
Permalink
01.02.11
Posted in Severe Weather Post-analysis, Weather News at 8:01 am by Rebekah

While 2010 had a slow start to the tornado season (see Where Have All The Tornadoes Gone?, Tornado Season So Far…, and Minnesota Leads U.S.; U.S. Back Near Average), it ended with a rare New Year’s Eve tornado outbreak.
40 tornadoes were reported between the morning of the 31st and the morning of the 1st. At least 7 people have died as a result of the twisters in Arkansas and Missouri.
Several of the tornadoes were rated EF3 on the Enhanced Fujita Scale, as lift from the big trough, warm, moist air ahead of an arctic cold front, and ample vertical wind shear provided the necessary conditions for strong tornadoes.
The last significant New Year’s Eve tornado outbreak occurred in 1947, when 20 people were killed and over 250 were injured.
So now that the year is over, how did 2010 stack up against the past few years in terms of tornadoes and tornado reports?
Tornado reports (2010 in red, ’05 to ’09 average in gray), from the Storm Prediction Center:
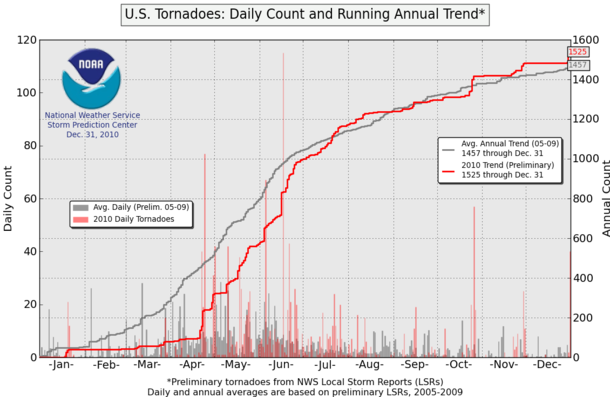
Note the year was below average until mid-July, at which point it fluctuated about the average and then ended just above average, with 1,525 tornado reports.
Tornado reports from ’05 through ’10, including the ’05 to ’09 average, in gray:
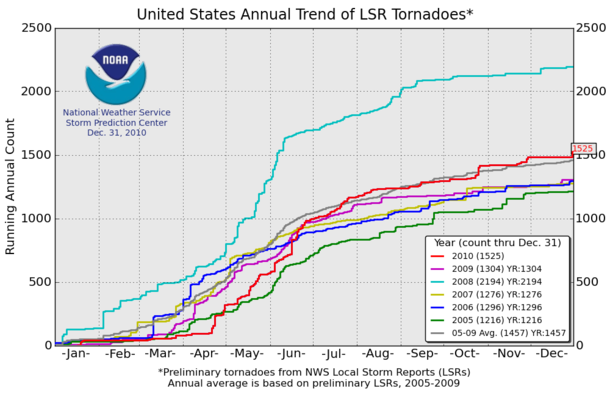
2010 was below the previous 5-year minimum until late April.
Adjusted tornado trend and percentiles (adjusted to account for over-reporting; for details on calculation, see SPC site):
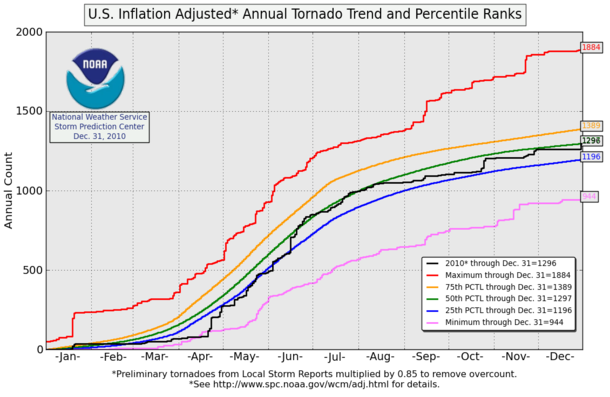
The estimated number of tornadoes in 2010 briefly dropped below the 1954 to 2007 minimum, before climbing up to just about the 50th percentile (the median). The year ended with an estimated 1,294 tornadoes.
For more detailed information on the New Year’s Eve 2010 tornado outbreak, check out the summaries/reports/photos from individual National Weather Service offices. Here are a few to get you started: Tulsa OK, St. Louis MO, Little Rock AR, and Jackson MS.
For more, go to the National Weather Service page and click on the area you are interested in.
Permalink
08.21.10
Posted in Severe Weather Post-analysis, Weather News at 11:50 pm by Rebekah
A microburst on the northeast side of Norman this evening left over 500 homes and businesses without power.
I received a trace of rain and heard a bit of thunder at my apartment on the north side of town, but looked at the radar and saw what I thought was just a small, weak thunderstorm. The wind blew a little bit, but only gusted to 32 mph at the airport.
On my way to a School of Meteorology get-together, I saw the road was blocked as a power pole was laying down in the road. Another power pole nearby was snapped about a third of the way up, and all of the traffic lights in that area were either not working or blinking red.
I noticed later that a local storm report for north Norman at 7 pm local time (CDT) read: “FROM 650-700PM NUMEROUS REPORTS OF DAMAGE BETWEEN 12TH AND 24TH BETWEEN ROBINSON AND ALAMEDA. 4 INCH DIAMETER LIMBS DOWN, POWER POLES SNAPPED, SHINGLES BLOWN OFF HOUSES.”
Here’s what the Oklahoma City TWDR (high-resolution radar) looked like at 6:51 pm CDT (from Weather Underground).
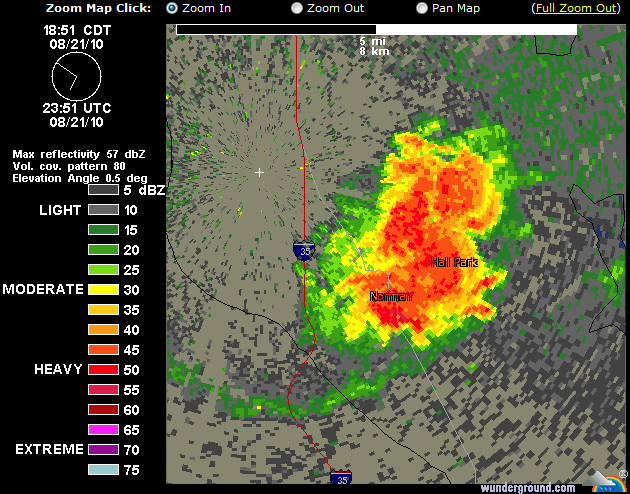
It doesn’t look like anything special, but now take a look at a base velocity image for the same time.
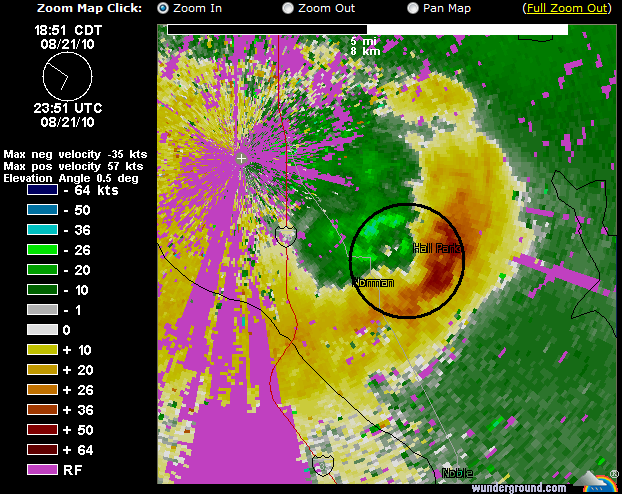
Note the area of orange and green between Norman and Hall Park (circled). This is a pretty classic microburst signature.
Negative numbers (green and blue colors) mean the wind is blowing towards the radar (location marked at the white “+” in the upper left), while positive numbers (yellow and orange) mean the wind is blowing away from the radar.
In this case, fairly strong winds are diverging over a small area between Norman and Hall Park. The radar estimates winds of 36 knots moving towards the radar and winds of 64 knots moving away from the radar, equating to 100 knots (115 mph) wind shear over about a 2 mile distance.
A microburst is a small column of rapidly descending air, which hits the ground and spreads out fast. A microburst is a type of downburst that occurs over a very localized area, defined as 2.5 miles in diameter or less. Microbursts/downbursts can occur as a thunderstorm is dying, and are capable of producing straight-line surface winds of over 150 mph.
Finally, here’s a meteogram from the Norman mesonet station, showing how several meteorological parameters have changed over the last 24 hours.
Note several things (this station is near the airport, and not quite on the northeast side of Norman):
- rapid drop in temperature between 6 and 7 pm (when the storm rolled through)
- increase in dewpoint at the same time, when it began to rain
- increase in wind speed and fluctuations in wind direction
- pressure rise
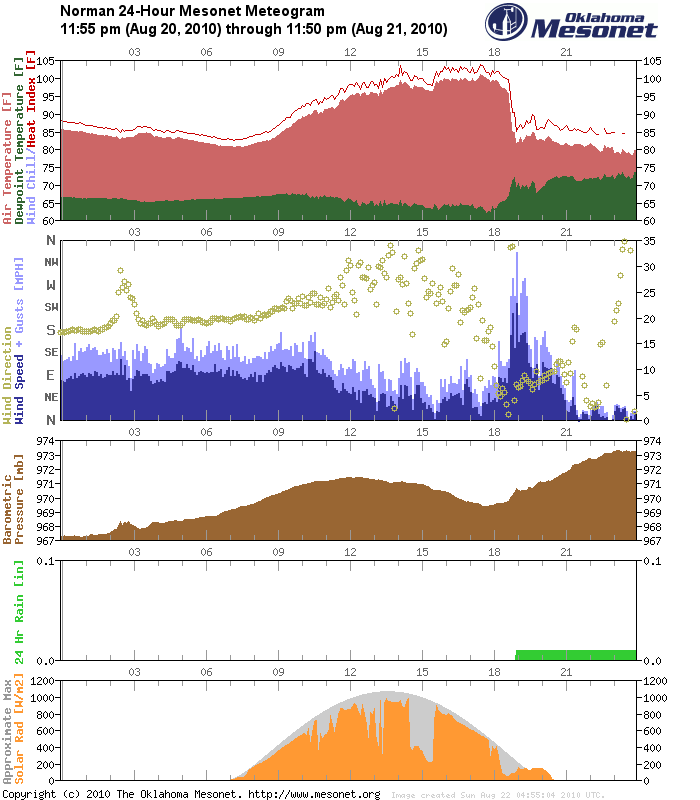
Also, take a look at the solar radiation plot–the gray area shows the maximum amount of solar radiation that we could be receiving this day, while the orange area shows the amount of solar radiation we actually did receive.
The orange area dips down whenever clouds pass over, and goes back up when it gets sunnier. Now note what happened just as the sun went down–the actual solar radiation was HIGHER than the maximum possible solar radiation! What’s up with that?
As I went out tonight, I saw everything bathed in orange. The sun was just going down, but the storm was to my southeast and the anvil was covering the sky. The sun was on the horizon, so the low beams of the sun bounced off the clouds just right and back towards earth, providing us with more solar radiation than we would have otherwise received.
Permalink
05.14.10
Posted in Severe Weather Post-analysis, Weather News at 1:36 pm by Rebekah
Updated as of 3pm…two upgrades to EF4!
On Monday, while I was up gallivanting around northern Oklahoma, there were two EF4 tornadoes that occurred within a 5-mile radius of my apartment! Looking even farther out, there were twoEF3 and two EF4 tornadoes that occurred within about a 30-mile radius of my apartment, and roughly ten tornadoes that occurred within that same radius.
The National Weather Service is still working on damage surveys following Monday’s tornado outbreak, but as of this morning, here’s a map of the tornadoes (click to enlarge) that occurred around central Oklahoma. Note the EF4 that passed over south Norman and Lake Thunderbird formed right around the National Weather Center. Yikes!
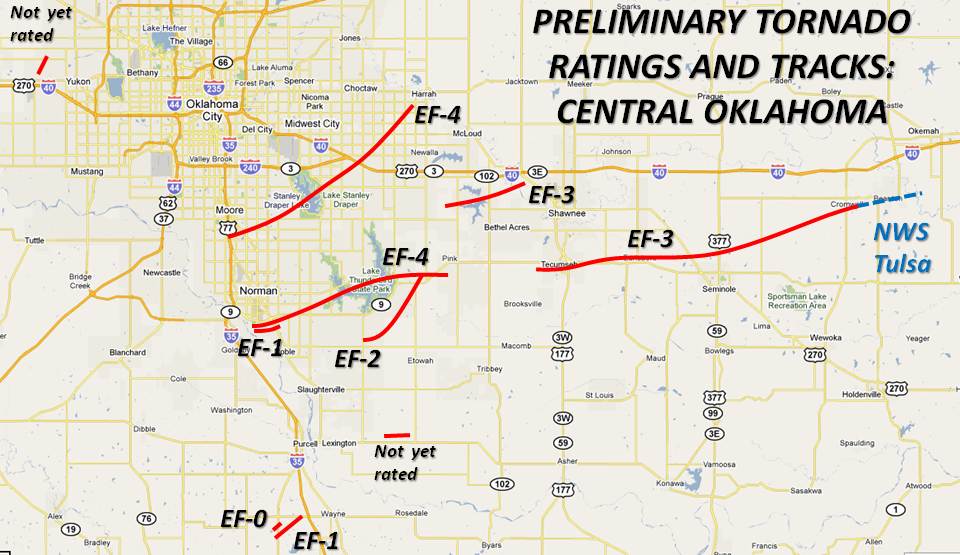
Tomorrow I hope to spend some time compiling some information on the outbreak and doing a post-storm analysis of the day. Once I get that together, I’ll make a webpage for it and post the link. For now, the National Weather Service in Norman has some good information, mostly on the tornado tracks (but it’s being updated pretty frequently), on their website, so you can check that out if interested in where some of the other tornadoes occurred and what they were rated.
The top rated tornadoes were EF4 (meaning the strongest tornadoes of the day passed through south Norman and Moore).
Later this afternoon and evening I plan on posting some photos and possibly video from Monday’s chase in northern Oklahoma, as well as a chase log and a few photos from Wednesday’s chase (long story short–saw an impressive tornadic supercell near Clinton, but didn’t see the tornado).
Permalink
« Previous Page — « Previous entries « Previous Page · Next Page » Next entries » — Next Page »


