01.29.11
Posted in Non-US Weather, Tropical Weather, Weather News at 8:00 am by Rebekah
Severe Tropical Cyclone Bianca, a weakening Category 3 tropical cyclone on the Australian rating system (Category 1 on the Saffir-Simpson Scale), has been taking a very strange trek along the western coast of Australia.
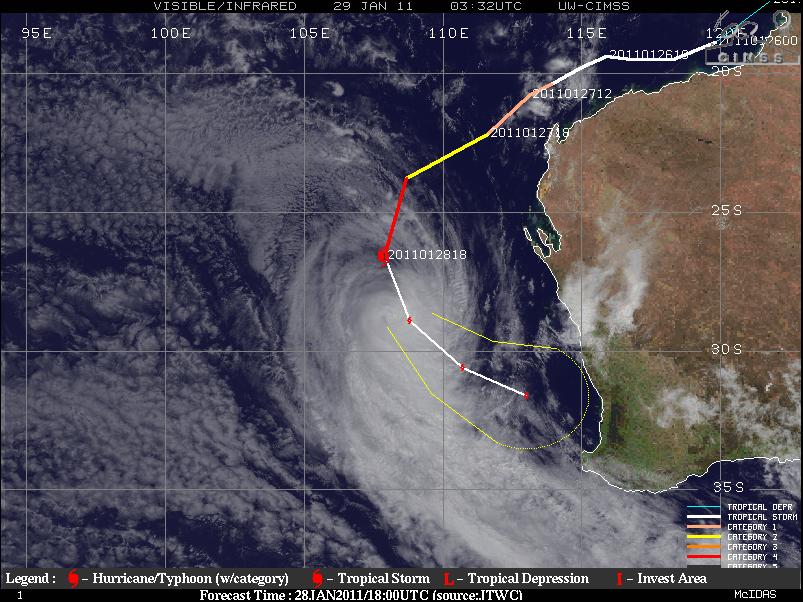
Satellite image, history, and forecast track of Bianca along Australia’s west coast. Source: CIMSS
Note how Bianca formed off the northwestern coast of Australia and proceeded to move almost parallel to the coast, all the way down to the southwestern coast, where the cyclone is expected to make landfall on Sunday.
Bianca’s maximum sustained winds are about 75 to 85 mph, but she is expected to keep weakening as she encounters cooler water temperatures and increased wind shear. The center of the cyclone is forecast to make landfall just south of Perth as a weak Aus. Cat. 1 (tropical storm on the SS-scale) or tropical low (tropical depression). Primary threats to the coast will be rough seas, heavy rainfall with possibly some localized flooding, and strong wind gusts up to about 60 mph.
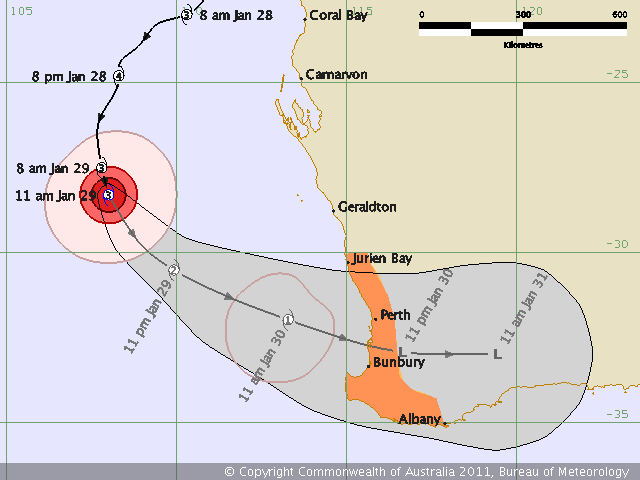
Bianca’s history and forecast track, as of Saturday morning Australian Western Standard Time, from the Australian Bureau of Meteorology
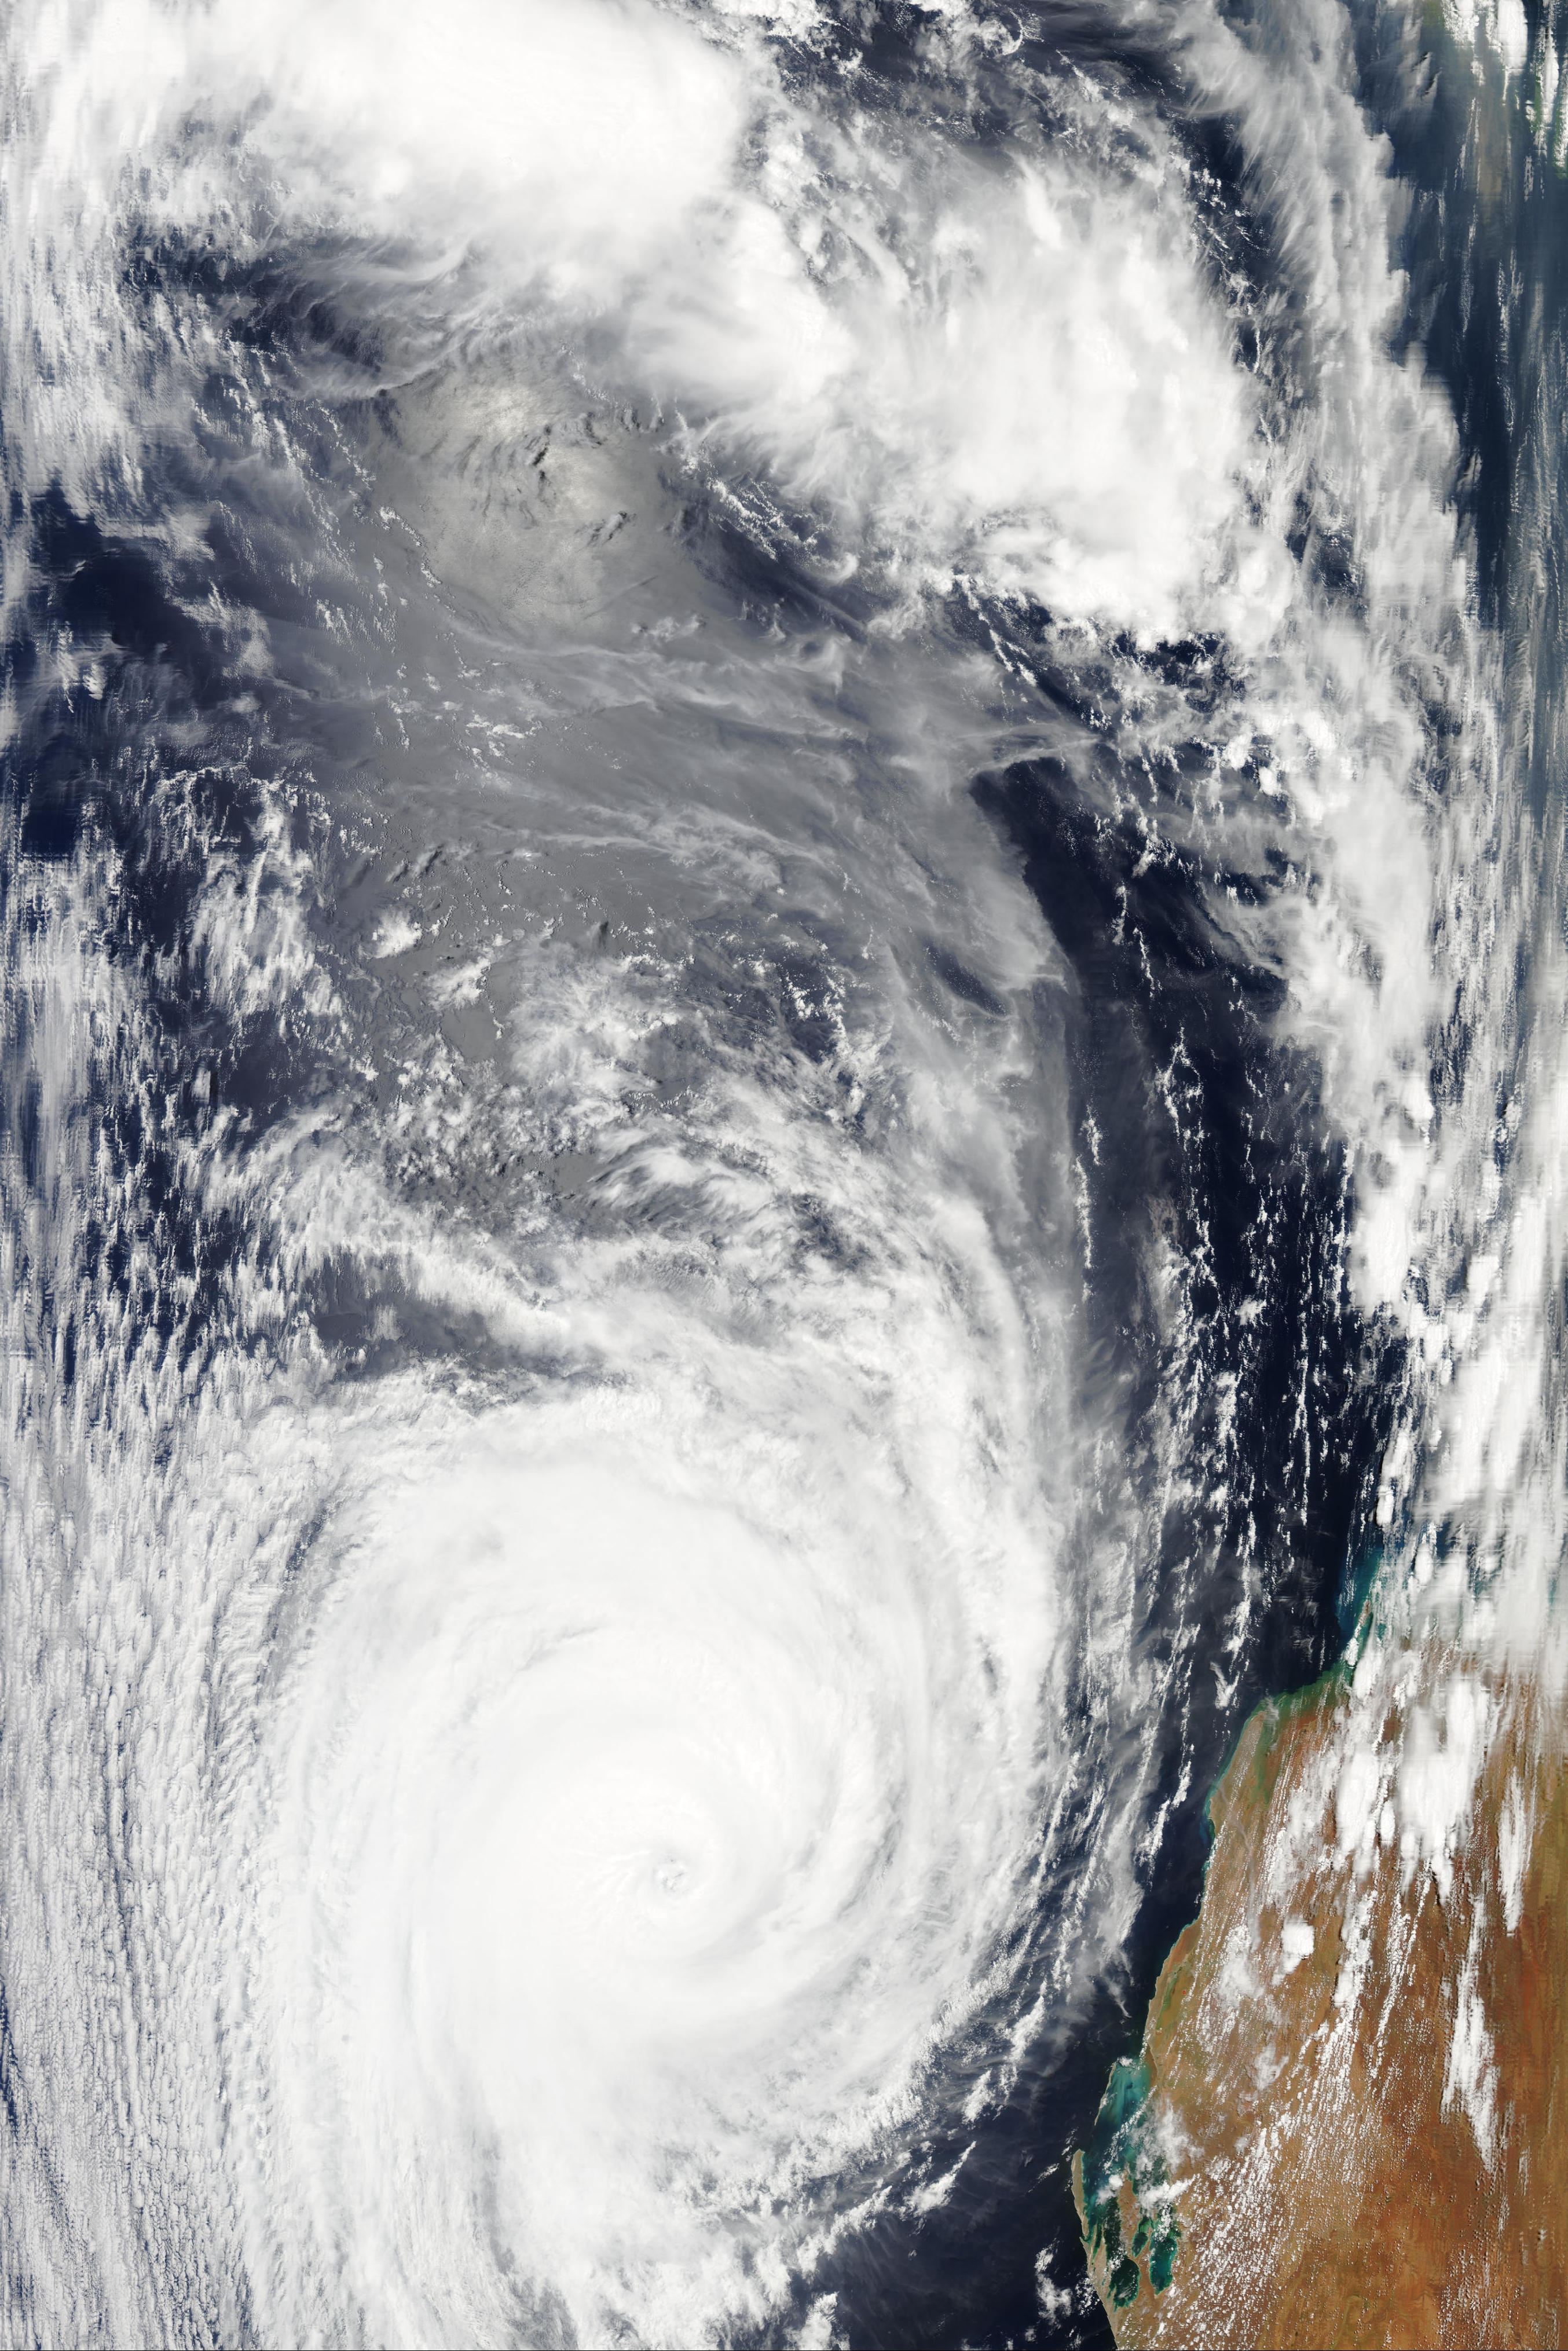
Bianca (click to enlarge), at 6:30 UTC on the 28th, via NASA’s Aqua/MODIS satellite (looks more impressive than the more recent image from early on the 29th…go to the “real-time” tab to see the latest images)
As a follow up to my post on Severe Tropical Cyclone Wilma the other day, Wilma is now only a shadow of her former self…the cyclone brushed past the northern coast of New Zealand, and now is just a low falling apart southeast of New Zealand.
For the latest on Tropical Cyclone Bianca, check out the Australian Bureau of Meteorology, Weather Underground, and CIMSS. To learn about tropical cyclone ratings in different ocean basins, check out the chart on this older blog post of mine.
Permalink
01.27.11
Posted in Non-US Weather, Tropical Weather, Weather News at 8:00 am by Rebekah
Severe Tropical Cyclone Wilma, the equivalent of a Category 3 (borderline Category 4) hurricane (as of Wednesday night) on the Saffir-Simpson scale, is about a thousand miles north of the northern island of New Zealand. As of Wednesday night, Wilma’s maximum winds were estimated at 130 mph (gusts to 160 mph). The tropical cyclone is moving west-southwest at about 13 mph, and is expected to make a gradual turn on Friday and may brush the northern coast of the northern island of New Zealand as a tropical storm on Saturday (if she holds together that long).
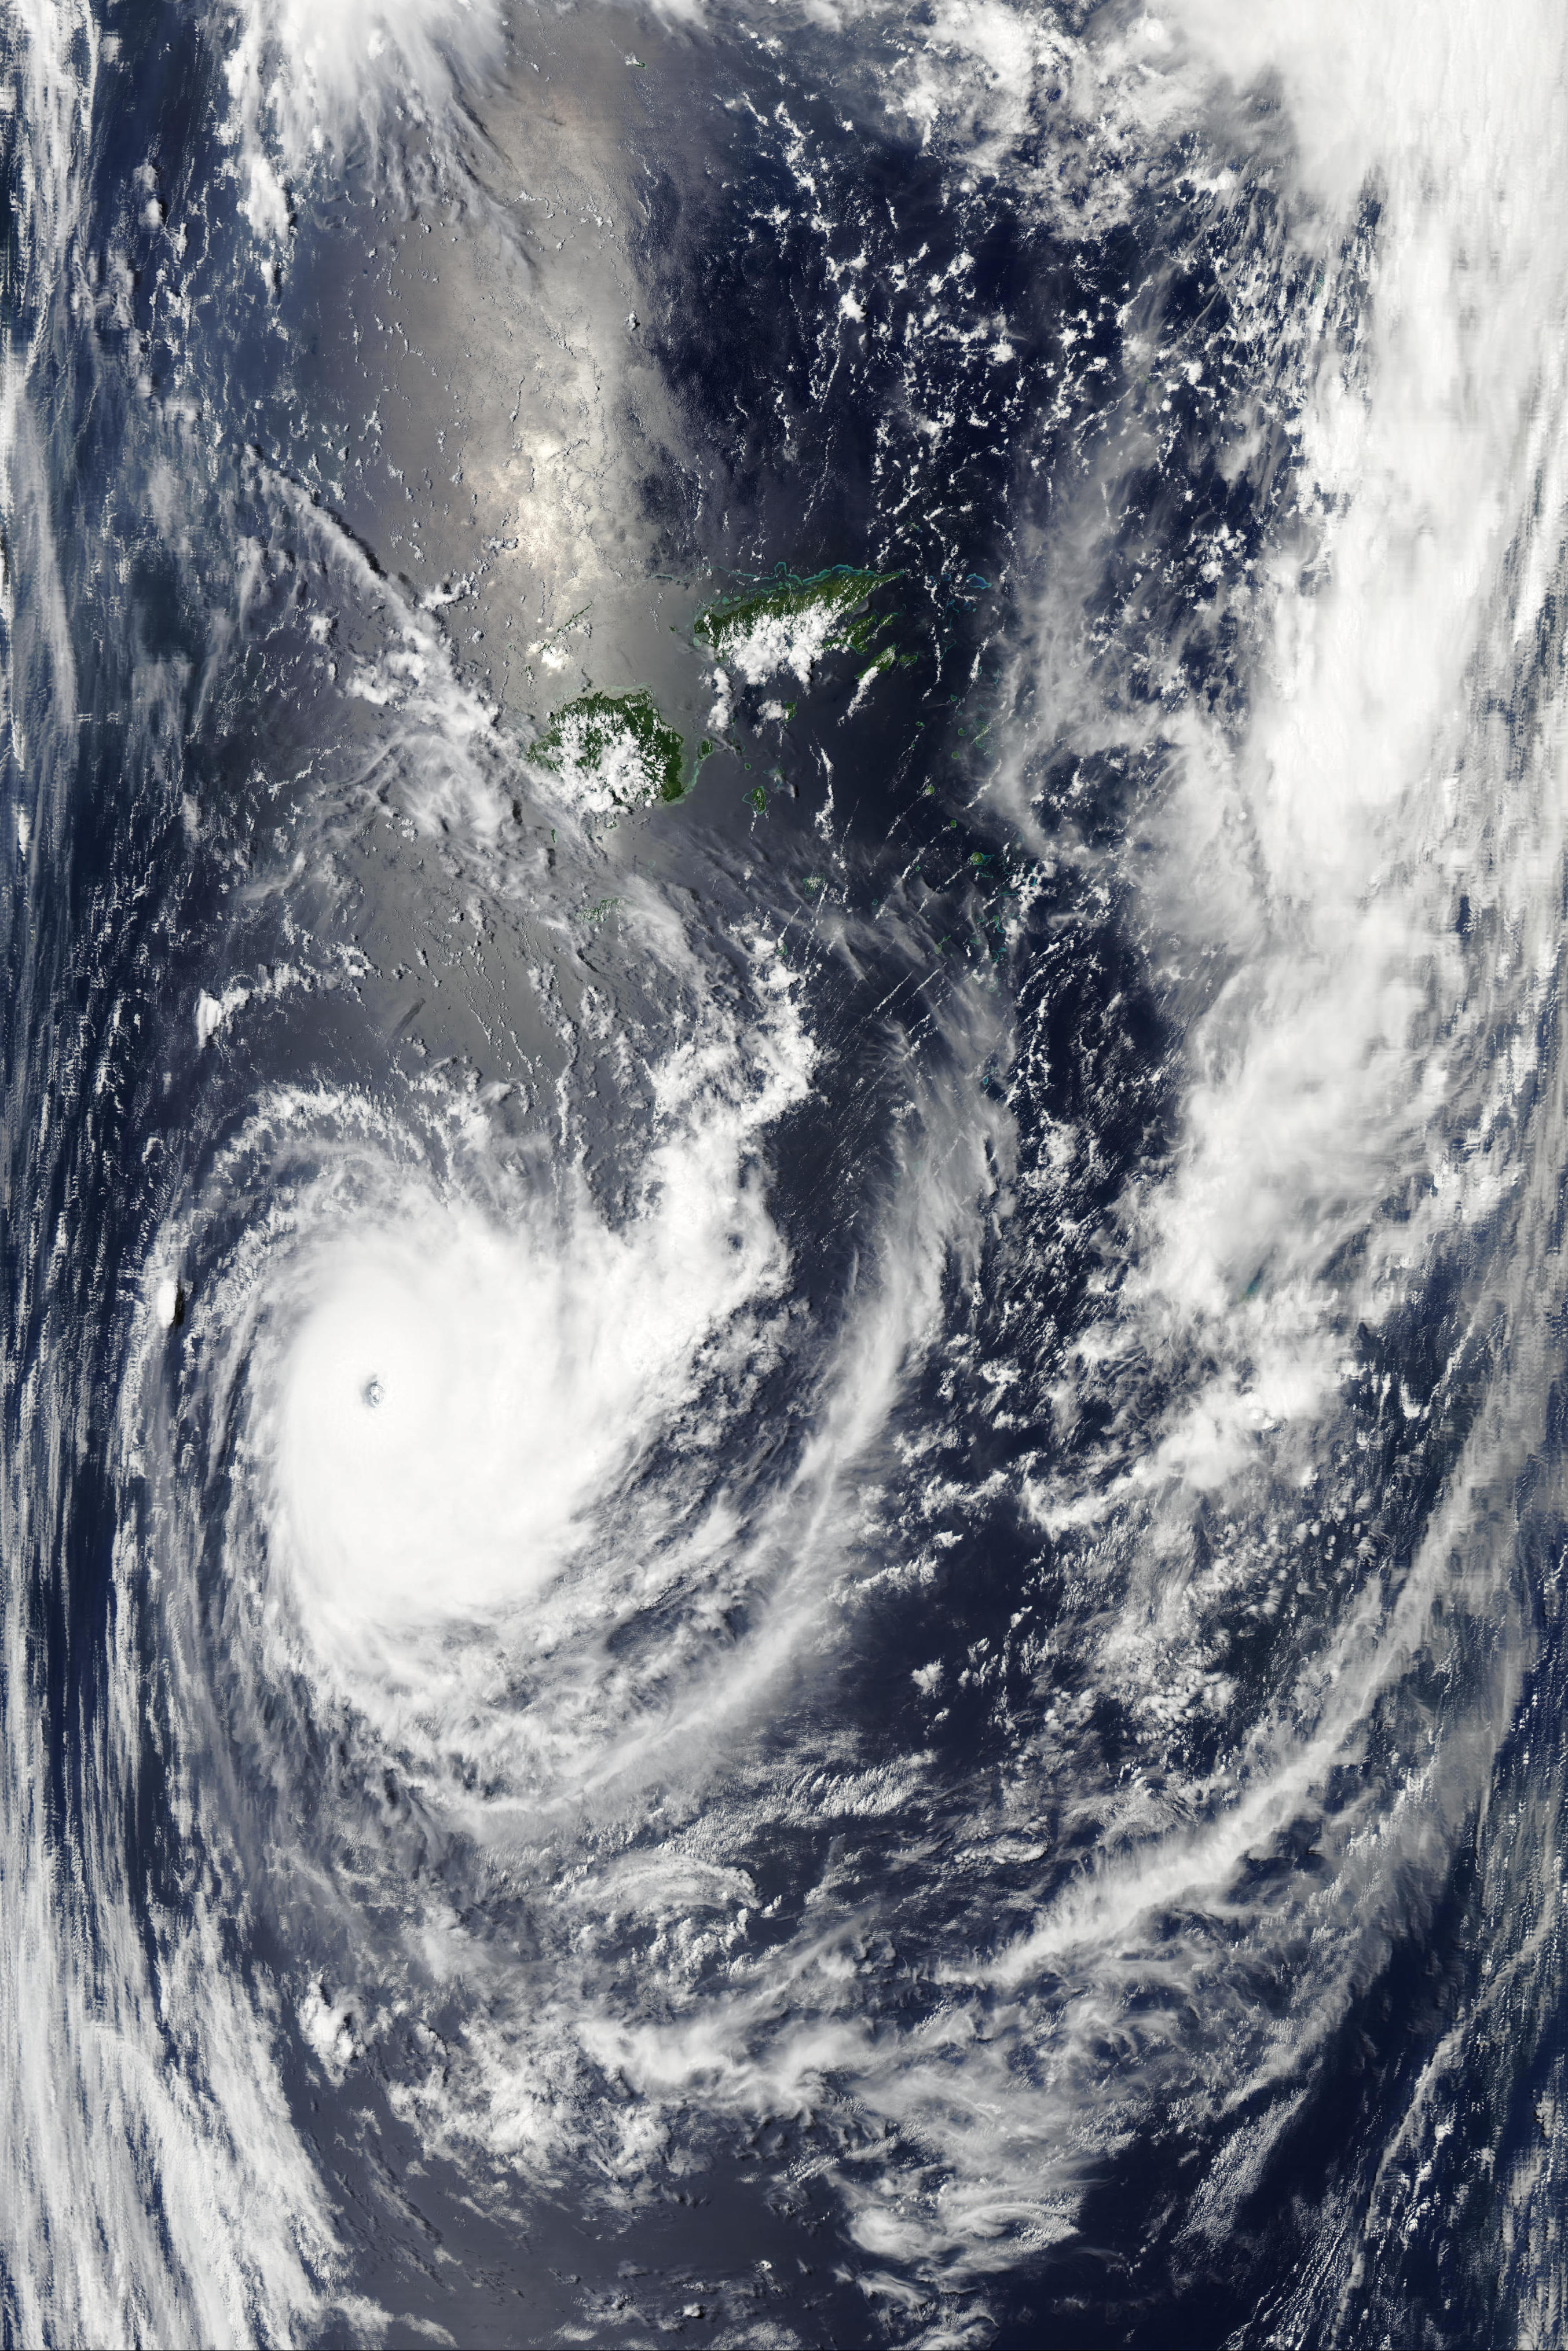
Aqua/MODIS image of Tropical Cyclone Wilma at 01:45 UTC…to zoom in to as much as 250 m resolution, see the NASA MODIS website, scroll down to the Aqua images from the 26th, and look towards the bottom right for 01:45 UTC.
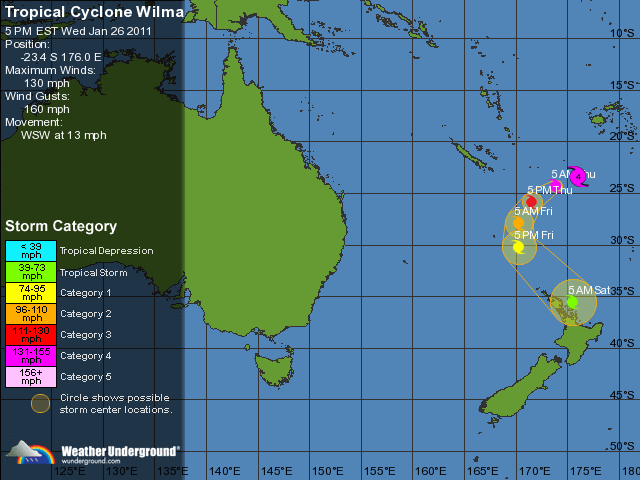
Wilma’s forecast track via Weather Underground
Permalink
01.12.11
Posted in Tropical Weather, Weather News at 8:00 am by Rebekah
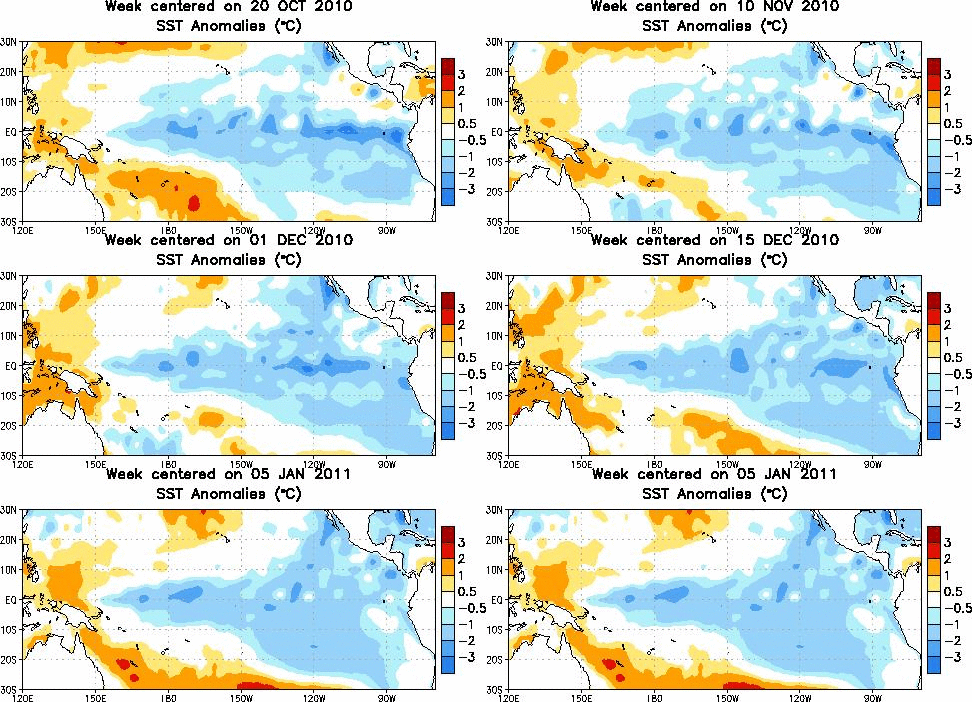
Last winter we experienced a moderately strong El Niño (see A Confused Robin and NWS Weather School), which was blamed in part for the snow and ice storms in the southern U.S. and the mild and dry weather in the Pacific Northwest (remember the winter Olympics?).
This winter, however, we are in the midst of a strong La Niña; one of the strongest on record, in fact.
What are El Niño and La Niña?
Normally, trade winds in the tropics blow from east to west. These winds push warm surface waters towards Australia (the western Pacific also has a lower typical surface pressure than the central Pacific, because of convergence occurring when the surface winds reach Australia and other islands). Near Peru, cold water rises up to take the place of the water that was pushed westward (this process is called upwelling).
During an El Niño, the trade winds weaken or possibly even reverse direction. Warm, tropical waters stay warm across the equatorial Pacific and upwelling decreases or stops.
La Niña is sort-of the opposite of an El Niño, where we just see “normal” go a little too far, in a manner of speaking, so upwelling is stronger and cold waters are colder than normal.
Current Events
Note in the figure above, from the Climate Prediction Center, the sea-surface temperatures across the tropics have lately been quite a bit cooler than normal, indicating a La Niña pattern.
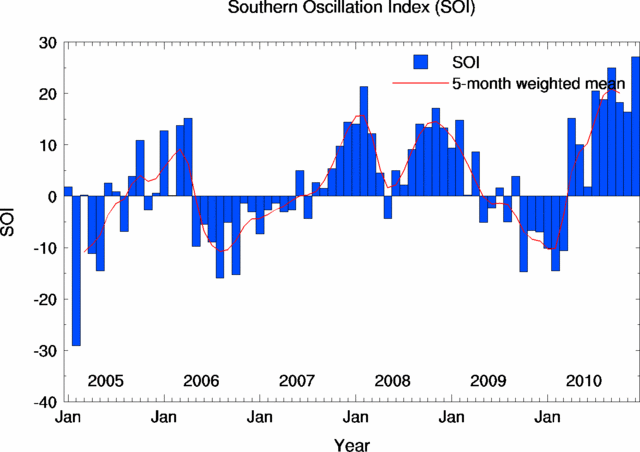
The Southern Oscillation Index (SOI), an Australian Bureau of Meteorology index for measuring the strength of El Niño / La Niña events (subtracts the surface pressure at Darwin, Australia from the surface pressure at Tahiti), has just recorded some of the highest positive (La Niña) values in history, including the highest value ever for December and the highest value since November 1973!
What does this mean for our weather?
Here’s a typical winter pattern for La Niña, from NOAA (bearing in mind that many other factors and ocean/pressure oscillations may affect the weather):
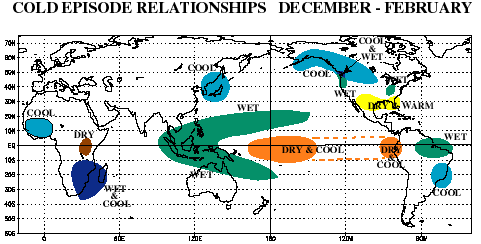
A couple of things to note: the Pacific Northwest was wetter than normal in December, but not necessarily cooler than normal. The Southwest and south central U.S. was warmer and drier than normal, but the Southeast (in fact all of the East) was quite a bit colder than normal and drier than normal. (To see recent climate maps, check out the CPC page here.)
Also, remember all the flooding going on in eastern Australia? Brisbane, the country’s third largest city, is currently bracing for record flooding. That’s due in some part to La Niña…various low-pressure systems and summer thunderstorms have aided in historic rainfalls and flooding. (Check out this video of cars being swept downstream in a flash flood in Toowoomba, Queensland.) Waters off the East Coast of Australia are also warmer than normal, which would help in producing convective showers.
Permalink
10.19.10
Posted in Non-US Weather, Tropical Weather, Weather News at 8:06 am by Rebekah
This week’s post in the global weather and climate series features Singapore.
-
-
-

Singapore montage, from Wikipedia (click to enlarge).
Singapore is a country made up of 63 islands located at the southern tip of the Malay Peninsula. Singapore is located just 85 miles north of equator, thus the country has a tropical climate. The capital city of the country of Singapore is Singapore (the city takes up much of the land area on the main island). The country is 274 mi² with a population of 5.1 million and a population density of about 18,000 per square mile. This makes Singapore third overall in terms of population density, after Macau and Monaco (each with over 40,000 per square mile). Singapore has recently been working on land reclamation, by expanding the size of their islands and joining some islands to make more room for people.
Singapore was first founded in the 2nd century AD, but burned down by Portuguese raiders in 1613. In 1819, Singapore was discovered by the British East India Trading Company, who signed a treaty to use the area as a trading post. Singapore officially became a British colony in 1824, though it was lost to the Japanese in just 6 days in World War II. After Japan surrendered, the British regained the country. Singapore became officially independent in 1965.
Singapore is currently the world’s 4th leading financial center, has the fastest growing economy in the world, and has been ranked with the best quality of life in Asia (and 11th around the world). Tourism is important to Singapore’s economy, though the country most heavily relies on exports and refining imported goods (especially manufacturing). An estimated 42% of Singapore’s population is foreign, and foreign workers make up 50% of the service sector. There are four official languages in Singapore: English (taught in schools), Malay (national language but more symbolic than spoken), Mandarin Chinese, and Tamil.
A few more facts about Singapore (from Wikipedia):
- Time zone: Singapore Standard Time (UTC+8)
- Elevation: 0 to 545 feet
- Climate zone: Tropical rainforest
- Average high temperature: 88 °F (31 °C)
- Average low temperature: 75 °F (24 °C)
- Average annual precipitation: 85 inches (2,150 mm)
The hottest months in Singapore are May and June, with the wettest months being November and December. Relative humidity is often 90% during the morning and 60% in the afternoon. Haze is common from August to October, when smoke from bush fires in Indonesia may affect the country. Occasionally the country may be affected by typhoons, but since Singapore is so close to the equator, most storms would stay well north.
Current weather: Based on the climatology of Singapore, the recent weather is about average. Highs this week are around 90 °F, lows of 77 °F with dewpoints in the mid- to upper 70s (that’s what keeps the temperature from getting lower…it can’t drop below the dewpoint, thus the nighttime humidity could be quite high and miserable). Some rain is expected this week, though the country is not likely to be affected by Typhoon Megi.
A recent reader commented that the humidity in Singapore sometimes goes up when there’s a typhoon affecting Asia. I might first speculate that this has something to do with the wind direction. If the typhoon is, as Megi is, near the South China Sea, then the wind direction over the Malay Peninsula may be from the southwest. However, Singapore is so close to the equator, the winds would not be strong enough to affect moisture in this way.
But if the change in humidity occurs more so before the typhoon draws near land, I could speculate that this may have something to do with the weather pattern that is bringing the typhoon towards Asia. For example, if there’s a ridge of high pressure over eastern Asia (see below…upper level ridge and upper-level winds in black), the surface winds around Singapore may be more from the east (green arrows in figure below). These easterly winds are part of what would push a typhoon towards Asia in the first place. Without knowing a lot about the geography and weather patterns in southeast Asia, I would suspect that an easterly wind would bring increased moisture from the South China Sea. However, the prevailing wind direction is likely from the east anyway, so I’m not sure if this along the right lines or not.
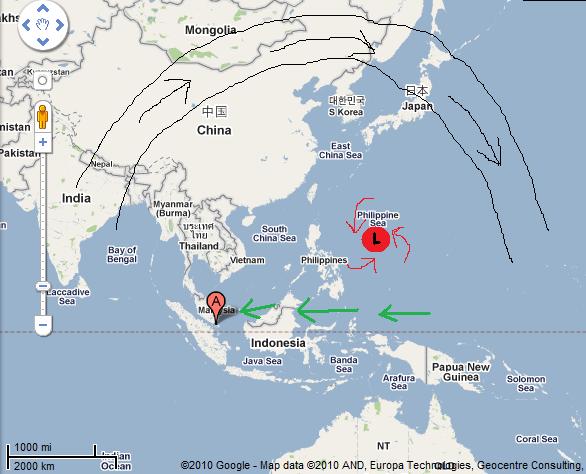
Map from Google Maps. Shows idealized wind patterns in eastern Asia, with upper-level ridge and winds in black, typhoon in red, and easterly surface winds below the ridge in green.
For weather maps and information on current and forecast Singapore weather, see the National Environment Agency (Singapore’s meteorological agency website), Weather Online UK (maps, models, and forecasts for around the world), and Weather Underground.
For more information on Singapore, here’s a link to Wikipedia.
Next Tuesday I plan to take a look at the climate and weather in another part of the globe. As always, if you have any comments or suggestions for future cities, please leave a comment!
Permalink
10.18.10
Posted in Non-US Weather, Tropical Weather, Weather News at 10:29 am by Rebekah
Super Typhoon Megi made landfall in the Philippines early this morning, on the northern end of the island of Luzon. With a reported pressure of 914 mb, Megi was one of the strongest landfalling tropical cyclones on record (Category 5 Dean in 2007 had a landfalling pressure of 905 mb).
Infrared satellite image of Megi at landfall, from Weather Underground:
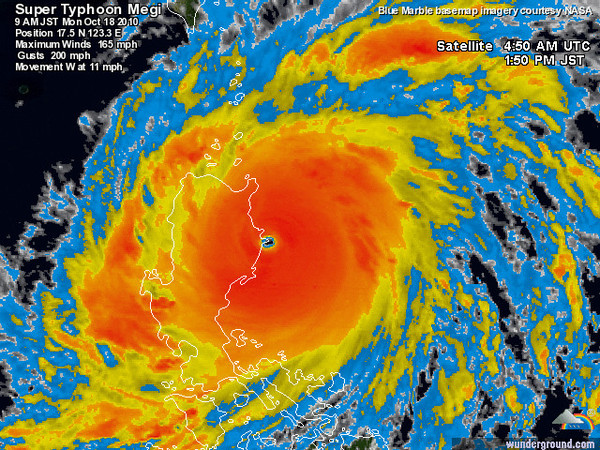
Megi bottomed out just before landfall at 885 mb, the strongest tropical cyclone since Hurricane Wilma in 2005 (882 mb, lowest pressure recorded in the Atlantic basin). Megi’s 10-minute sustained maximum winds peaked at 145 mph…1-minute sustained winds, which are used in the US to determine the ranking on the Saffir-Simpson Scale, peaked at 185 mph. Wind gusts were up to 220 mph.
Different ocean basins have different classification schemes for tropical cyclones, hence the different names. If Megi were in the Atlantic or eastern Pacific, the tropical cyclone would have been classified a Category 5 hurricane. In the waters of the western Pacific, Megi was called a “super typhoon”.
For more information on how tropical cyclones are classified based on ocean basin, see the chart on one of my previous blog entries, “Tropical Cyclone Ului Make Landfall in Australia“.
You may have heard Megi being called “Juan” as well. Megi is the “official” name for the tropical cyclone, but the Philippine Meteorological Service is calling the storm Juan. Different countries are allowed to have their own names for the storms, though the official naming goes to the World Meteorological Organization, who names the storm based on a list of names contributed to by various countries around the western Pacific.
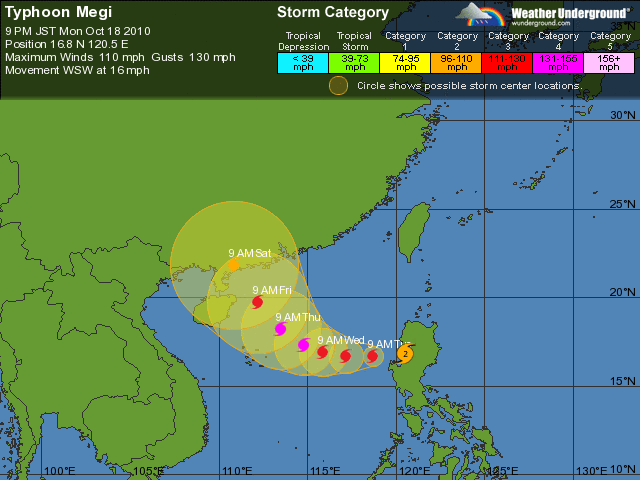
Megi is now the equivalent of a Category 2 on the Saffir-Simpson Scale, but is expected to increase to the equivalent of a Category 4, before decreasing in intensity again and striking the south China coast somewhere just south of Hong Kong.
Weather Underground forecast track map (click to enlarge):
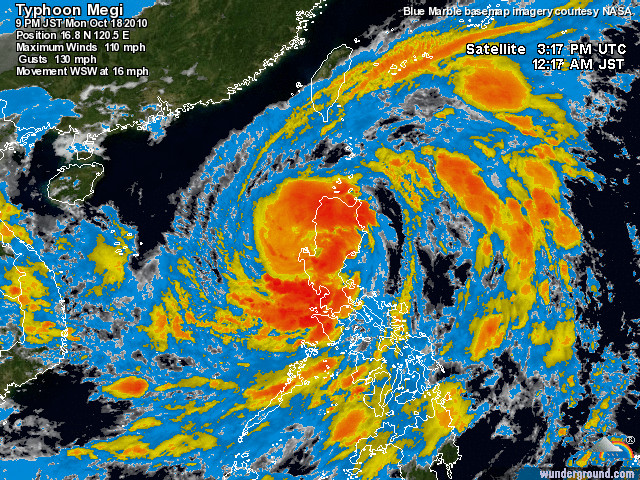
Here’s what Megi looks like right now on satellite, from Weather Underground:
Permalink
« Previous Page — « Previous entries « Previous Page · Next Page » Next entries » — Next Page »


