12.11.10
Posted in Weather News, Winter Weather at 1:49 pm by Rebekah
Here’s the latest map of surface observations in the Midwest (click to enlarge), from UCAR.
For those of you who don’t know what you’re looking at, the big dots mark weather station locations, the lines going into the dots show wind direction (while the lines coming off those lines show wind speed), the red numbers are temperature, the green numbers are dewpoint, and the symbols show the weather type (e.g., snow in asterisks, rain in dots).
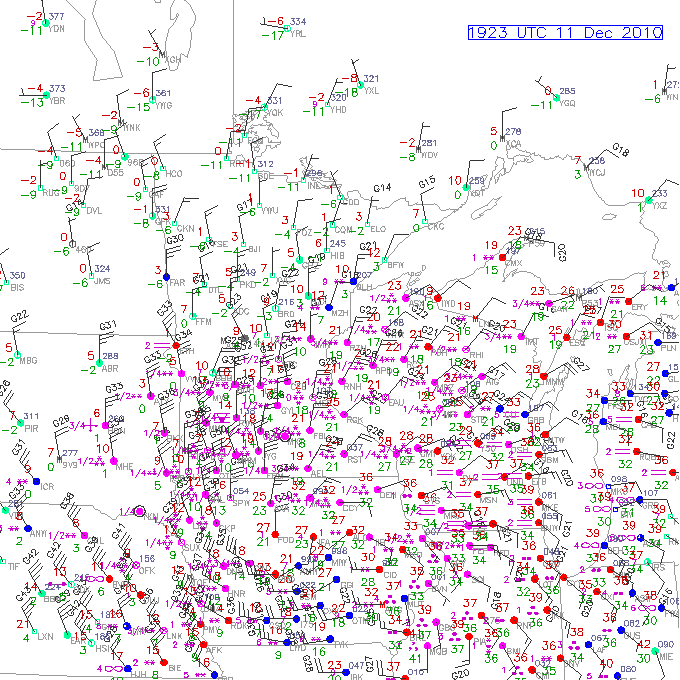
Note how the winds are swirling counter-clockwise around northern Iowa. This marks the location of the surface low. Note also how there is a lot of snow falling in northern Iowa and southern Minnesota!
A blizzard is defined as blowing snow (doesn’t have to be falling) with winds of at least 35 mph and visibility of less than 1/4 mile for at least 3 hours. The strongest winds around a low-pressure system are typically on the northwest side, hence why the worst of this blizzard may actually be once the low has moved farther east.
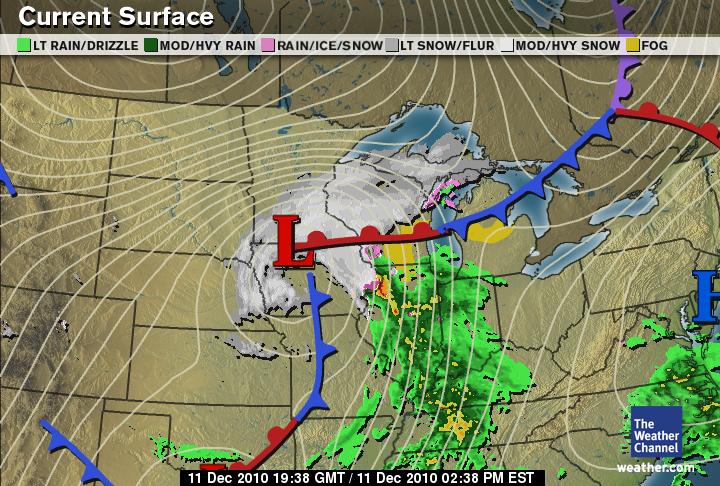
Weather Channel surface map:
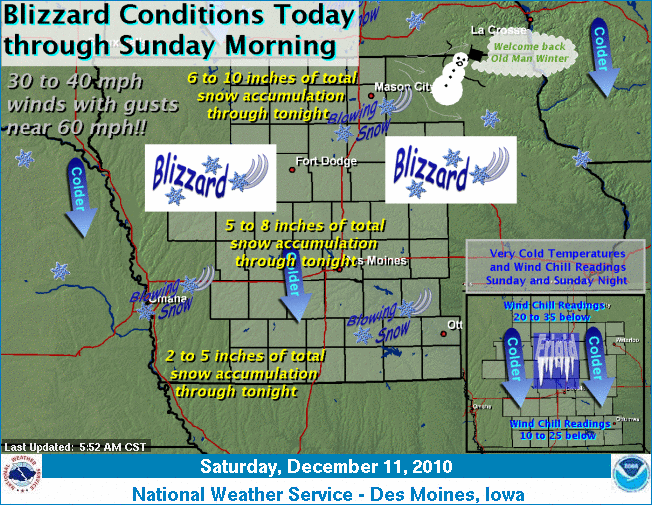
NWS Des Moines weather forecast:
Permalink
11.10.10
Posted in Weather News, Winter Weather at 6:51 pm by Rebekah
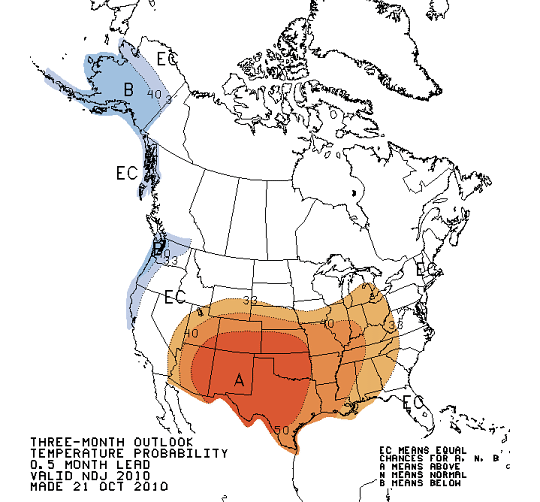
Here’s the Climate Prediction Center‘s outlook for November, December, and January, as of October 21. Keep in mind that the colors shown are probabilities of having above or below normal temperature or precipitation. A is above, B is below, and EC is equal chance.
Temperature:
Precipitation:
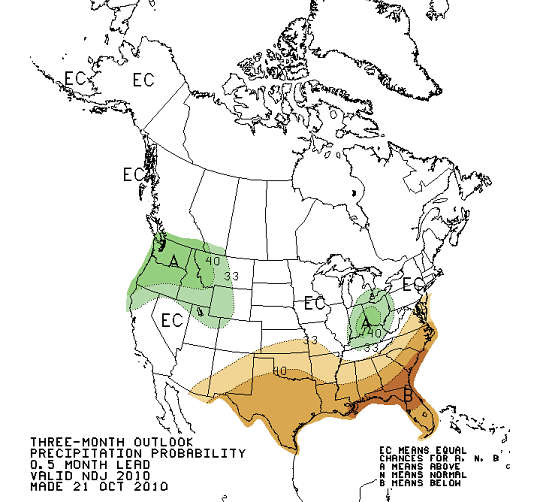
These maps are primarily based off of ENSO (El Niño / La Niña). We’re currently in a La Niña pattern, but there are other factors that play a role in what our climate may do in the next few months, so take these maps with a grain of salt!
Permalink
11.09.10
Posted in Non-US Weather, Weather News at 3:26 pm by Rebekah
This week’s post in the global weather and climate series features Cagliari, Sardinia, Italy.
-
-
-
-
-
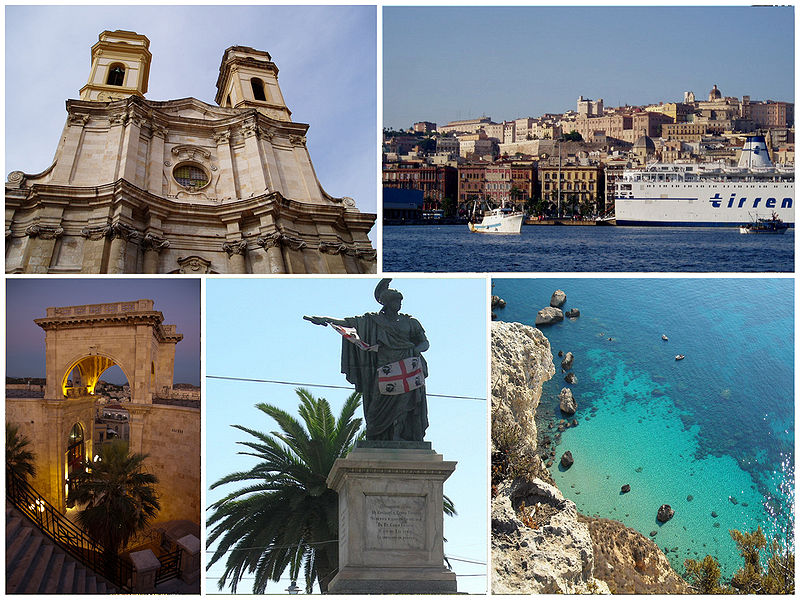
Around Cagliari. Click to enlarge. Courtesy of Wikipedia.
Cagliari is located on the southern coast of Sardinia, an island and Italian province off the western coast of Italy. Cagliari is the capital of Sardinia and is home to nearly 160,000 people (about 400,000 in the metro). This city was established some time in or before the 7th century B.C., between the sea, fertile plains, and mountains. Today, Cagliari has one of the largest fish markets in Italy and tourism is a major part of economy.
A few more facts about Cagliari (from Wikipedia):
- Time zone: Central European Time (UTC+1) or Central European Summer Time (UTC+2)
- Elevation: 13 feet
- Climate zone: Mediterranean
- Average high temperature: 70 °F (21 °C)
- Average low temperature: 53 °F (12 °C)
- Average annual precipitation: 17 inches (426 mm)

Via Roma in Cagliari. Click to enlarge. Courtesy of Wikipedia.
Current weather: This week in Cagliari, highs are in the mid-60s and lows are in the low 50s. Skies are expected to be mostly clear, after a chance of rain Wednesday night and Thursday night.
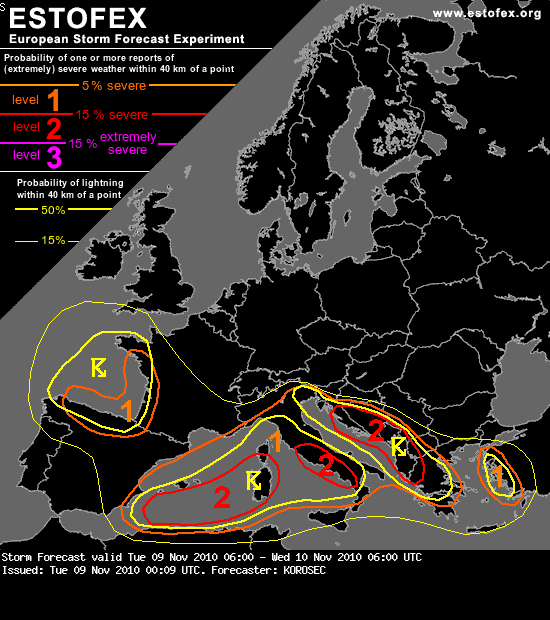
With a trough and an associated surface low moving over France today,y there is a decent chance for severe weather (strong wind gusts, tornadoes, and excessive convective rainfall) in Sardinia and across much of the Mediterranean. ESTOFEX, the European Storm Forecast Experiment, has made the following forecast:
For weather maps and information on current and forecast Cagliari weather, see the Meteo Italia (Italian’s national weather service, in Italian), Weather Underground, and Weather Online UK (maps and models).
For more information on Cagliari, here’s a link to Wikipedia.
Next Tuesday I plan to take a look at the climate and weather in another part of the globe. As always, if you have any comments or suggestions for future cities, please leave a comment!
Permalink
10.26.10
Posted in Weather News at 6:07 pm by Rebekah
Series note: from here on out, I will skip Antarctica in the World Wide Weather continental rotation. Occasionally we may return there, but for now, we’ll rotate through just the other 6 continents.
This week’s post in the global weather and climate series features International Falls, Minnesota.
There is currently a very strong extratropical cyclone centered just north of International Falls, so we’ll be taking a brief look at that today.
-
-
-
-
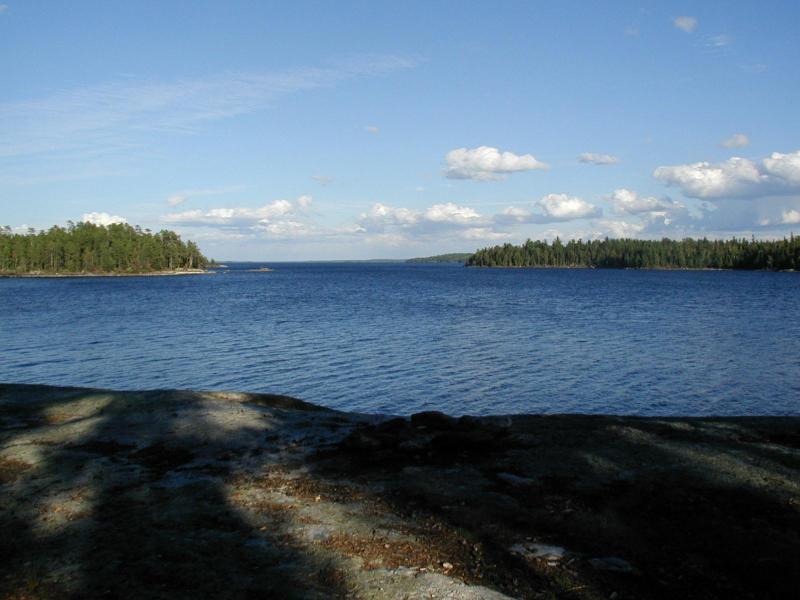
Rainy Lake, on the Canadian border near International Falls, Minnesota. From MinnesotaLakes.net. Click to enlarge.
International Falls is located in northern Minnesota, just across the Rainy River from Lake Frances, Ontario, Canada. The city is officially known as the “Icebox of the Nation”, following a 2008 trademark lawsuit with Fraser, Colorado. International Falls receives bitterly cold and snowy winters, but humid and hot summers. Settlers first arrived in the area in the 1600s, but the city did not become incorporated until 1909. The population (census 2000) of International Falls is 6,703.
A few more facts about International Falls (from Wikipedia):
- Time zone: Central Standard Time (UTC-6) or Central Daylight Time (UTC-5)
- Elevation: 1,122 feet
- Climate zone: Humid continental
- Average high temperature: 49 °F (9 °C)
- Average low temperature: 26 °F (-3 °C)
- Record high temperature: 103 °F (39 °C)
- Record low temperature: -55 °F (-48 °C)
- Average annual precipitation: 24 inches (608 mm)
- Average annual snowfall: 68 inches (173 cm)
Current weather: Focusing on the record-breaking low-pressure system affecting International Falls, here’s the latest surface map from The Weather Channel, as of 5:43 pm CDT (click to enlarge):
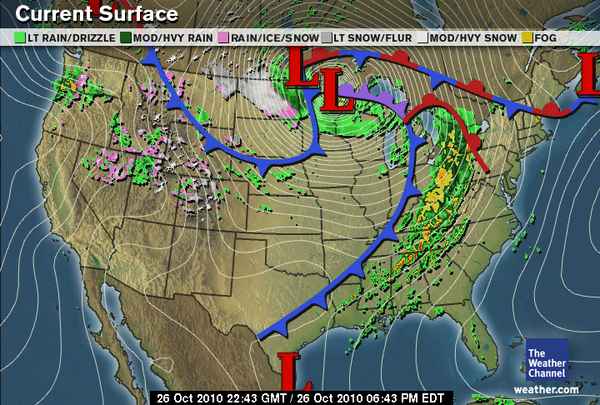
As you can see, there is a large low-pressure system centered just north of the Canadian border, with a very tight pressure gradient (the lines on the map are isobars, lines of equal pressure).
Now here’s another surface map, showing actual observations, from the Oklahoma Weather Lab from 3 hours ago, at 3 pm CDT (the more recent one has a slightly lower pressure, but the contours ended at the border):
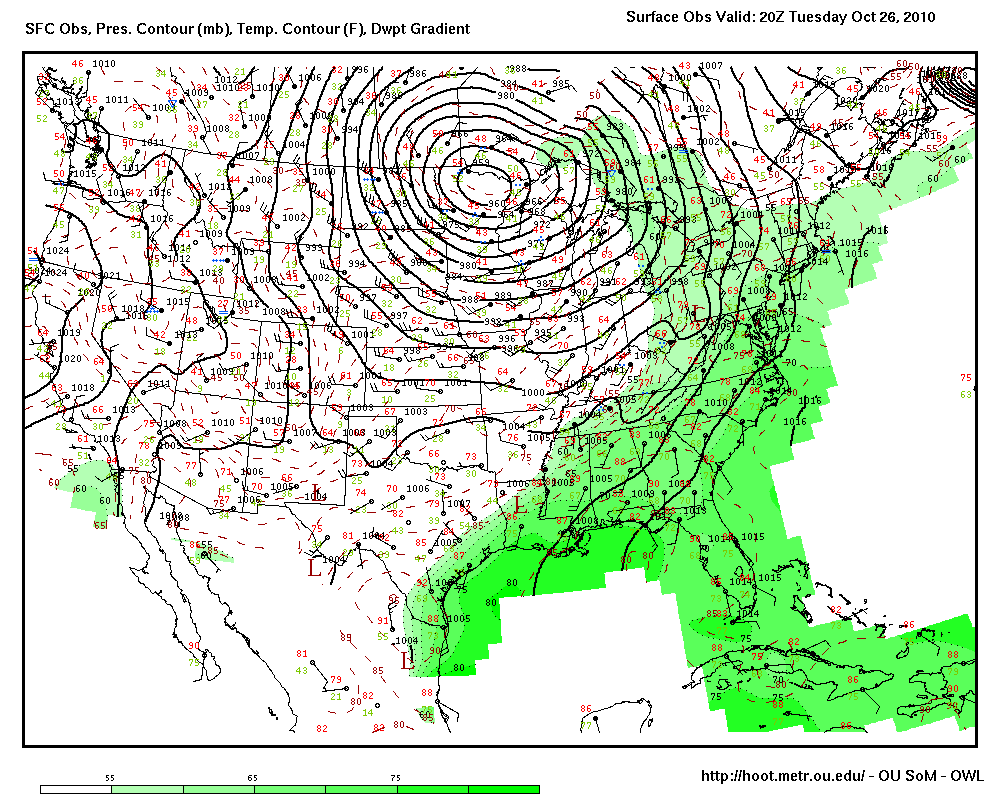
Note how the contours are so close together. Note also the low pressure–on this map, the pressure at International Falls was 959 mb! Actually, this extratropical cyclone set new minimum, non-tropical pressure records in Minnesota and Wisconsin as well as the US as a whole. So aside from landfalling hurricanes, this system brought the lowest pressure ever recorded over the US mainland: 956 mb! This is the equivalent pressure of about a Category 3 hurricane!
The pressure is so low, and the pressure gradient is so tight, the winds around the low are very strong. There have been some gusts to well over 60 mph in the Upper Midwest.
Today has also been an active severe weather day, as storms have formed all along a cold front as well as out ahead of the cold front, producing high winds and tornadoes.
As I mentioned yesterday, if the air behind this system was just a little colder, there would be the potential for a major blizzard over the Northern Plains. As it is, there is some snow falling (see the Weather Channel map, above), but not enough for a big blizzard.
For weather maps and information on current and forecast International Falls weather, see the National Weather Service and Weather Underground.
For more information on International Falls, here’s a link to Wikipedia and here’s a link to the city’s webpage.
Next Tuesday I plan to take a look at the climate and weather in another part of the globe. As always, if you have any comments or suggestions for future cities, please leave a comment!
Permalink
10.25.10
Posted in Weather News at 11:51 am by Rebekah
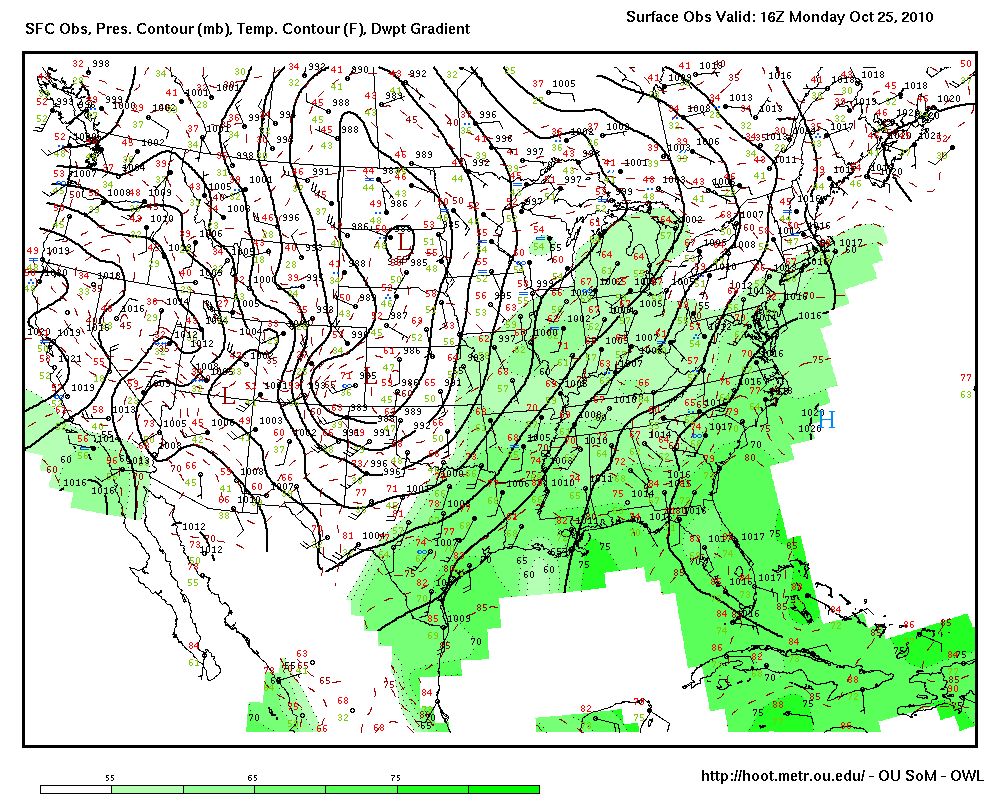
Surface observations at 11 am Central Time, from the Oklahoma Weather Lab. Click to enlarge.
A surface map of the U.S. right now shows an elongated area of low pressure over the Great Plains. The lowest pressure on this map is 984 mb.
This low pressure system is expected to rapidly strengthen today and tonight, and could even bomb out. A bomb cyclone is a mid-latitude cyclone with a pressure that drops by 24 mb in 24 hours…the GFS model (below) shows that the pressure of this cyclone could get down to 960 mb in about 24 hours.
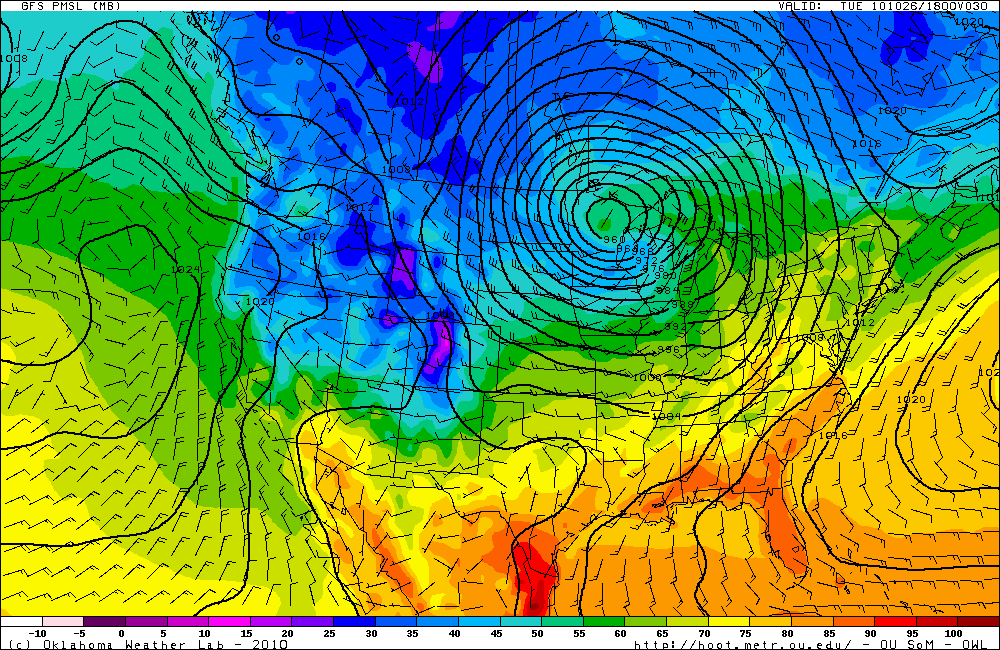
GFS model valid at 18Z (1 pm Central Time) Tuesday, showing surface pressure and temperature. Click to enlarge.
When the pressure gradient becomes this strong, the wind speeds increase. High wind watches have already been issued for much of the Midwest. The National Weather Service says that sustained winds of 4o to 50 mph are expected behind this low pressure system, and gusts could get to 55 mph late tomorrow.
A cyclone that strengthens to 960 mb over land does not happen very often. If this same cyclone occurred in another month or two, there would likely be a big blizzard. However, the air behind the cold front associated with this system is not quite cold enough for snow just yet.
For more on the how this cyclone is expected to develop, please see Jeff Makowski’s blog: Mid-week Storm
Permalink
« Previous Page — « Previous entries « Previous Page · Next Page » Next entries » — Next Page »


