08.21.10
Posted in Severe Weather Post-analysis, Weather News at 11:50 pm by Rebekah
A microburst on the northeast side of Norman this evening left over 500 homes and businesses without power.
I received a trace of rain and heard a bit of thunder at my apartment on the north side of town, but looked at the radar and saw what I thought was just a small, weak thunderstorm. The wind blew a little bit, but only gusted to 32 mph at the airport.
On my way to a School of Meteorology get-together, I saw the road was blocked as a power pole was laying down in the road. Another power pole nearby was snapped about a third of the way up, and all of the traffic lights in that area were either not working or blinking red.
I noticed later that a local storm report for north Norman at 7 pm local time (CDT) read: “FROM 650-700PM NUMEROUS REPORTS OF DAMAGE BETWEEN 12TH AND 24TH BETWEEN ROBINSON AND ALAMEDA. 4 INCH DIAMETER LIMBS DOWN, POWER POLES SNAPPED, SHINGLES BLOWN OFF HOUSES.”
Here’s what the Oklahoma City TWDR (high-resolution radar) looked like at 6:51 pm CDT (from Weather Underground).
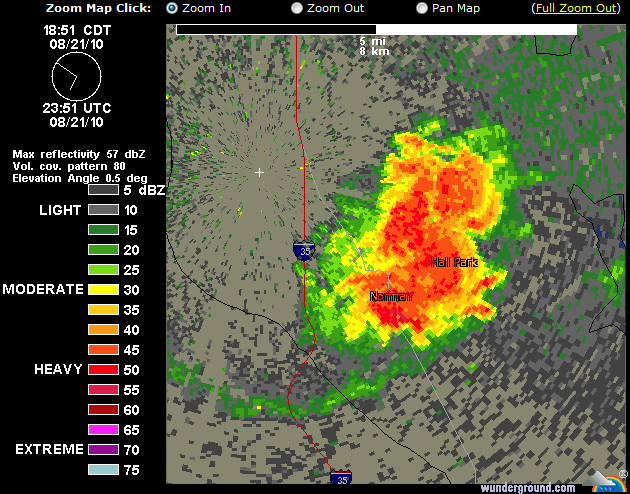
It doesn’t look like anything special, but now take a look at a base velocity image for the same time.
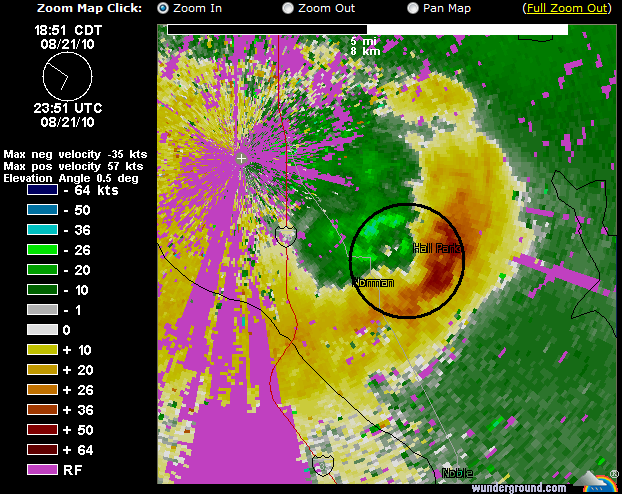
Note the area of orange and green between Norman and Hall Park (circled). This is a pretty classic microburst signature.
Negative numbers (green and blue colors) mean the wind is blowing towards the radar (location marked at the white “+” in the upper left), while positive numbers (yellow and orange) mean the wind is blowing away from the radar.
In this case, fairly strong winds are diverging over a small area between Norman and Hall Park. The radar estimates winds of 36 knots moving towards the radar and winds of 64 knots moving away from the radar, equating to 100 knots (115 mph) wind shear over about a 2 mile distance.
A microburst is a small column of rapidly descending air, which hits the ground and spreads out fast. A microburst is a type of downburst that occurs over a very localized area, defined as 2.5 miles in diameter or less. Microbursts/downbursts can occur as a thunderstorm is dying, and are capable of producing straight-line surface winds of over 150 mph.
Finally, here’s a meteogram from the Norman mesonet station, showing how several meteorological parameters have changed over the last 24 hours.
Note several things (this station is near the airport, and not quite on the northeast side of Norman):
- rapid drop in temperature between 6 and 7 pm (when the storm rolled through)
- increase in dewpoint at the same time, when it began to rain
- increase in wind speed and fluctuations in wind direction
- pressure rise
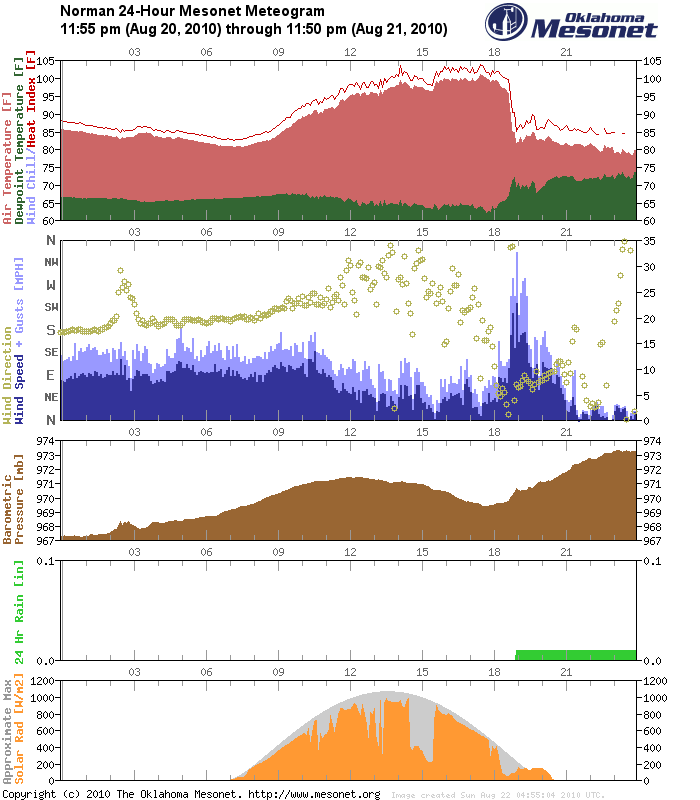
Also, take a look at the solar radiation plot–the gray area shows the maximum amount of solar radiation that we could be receiving this day, while the orange area shows the amount of solar radiation we actually did receive.
The orange area dips down whenever clouds pass over, and goes back up when it gets sunnier. Now note what happened just as the sun went down–the actual solar radiation was HIGHER than the maximum possible solar radiation! What’s up with that?
As I went out tonight, I saw everything bathed in orange. The sun was just going down, but the storm was to my southeast and the anvil was covering the sky. The sun was on the horizon, so the low beams of the sun bounced off the clouds just right and back towards earth, providing us with more solar radiation than we would have otherwise received.
Permalink
Posted in Tropical Weather, Weather News at 4:02 pm by Rebekah
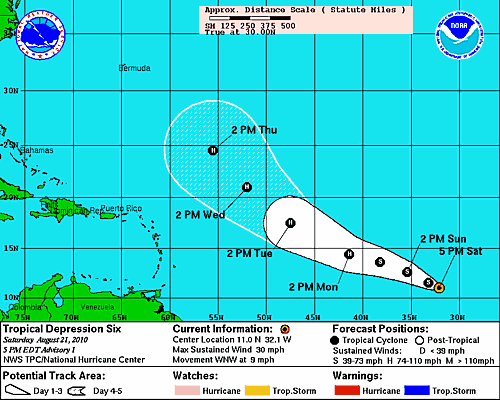
Last night I posted on a tropical disturbance off the Cape Verde Islands that had the potential to become a hurricane within a few days.
Within the last hour, this system has become organized enough for the National Hurricane Center to upgrade it to Tropical Depression 6 (TD6). The above map shows the NHC forecast track. They have it becoming Tropical Storm Danielle sometime tonight, and a hurricane by Monday afternoon.
The NHC discussion on TD6 mentions “the NHC forecast is close to the SHIPS/LGEM models…showing a large powerful hurricane over the central Atlantic Ocean in a few days.”
Here’s a model intensity forecast for TD6 from Weather Underground, showing the results of 4 different models. Keep in mind that forecast intensity is not always very good very far out.
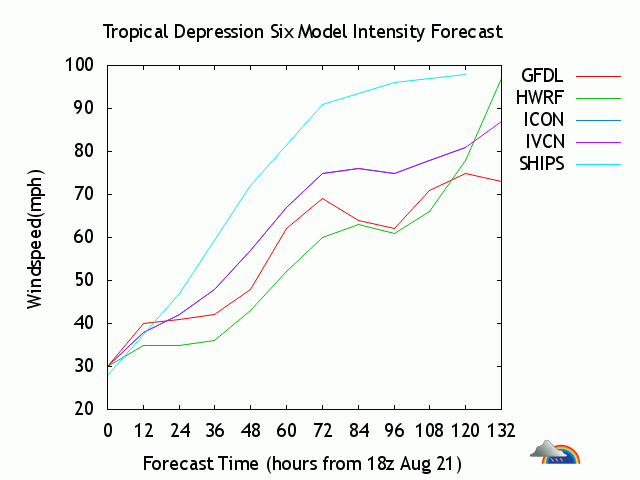
Category 1 hurricanes have winds of 74 to 95 mph and Category 2 have winds of 96 to 110 mph.
Stay tuned.
Permalink
08.20.10
Posted in Tropical Weather, Weather News at 9:37 pm by Rebekah
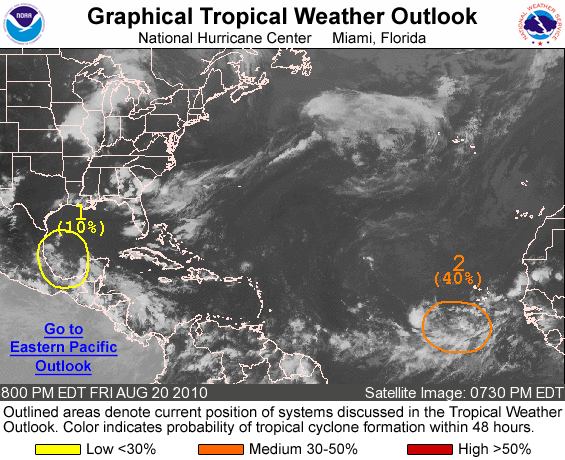
An area of low pressure just southwest of the Cape Verde Islands shows some promise for tropical development within the next several days (#2 on the NHC graphic above).
In an area with sea-surface temperatures in the mid- to upper 80s and deep layer wind shear of 10 to 15 knots (and moving into even warmer waters and calmer winds aloft), this low has the potential to become a tropical storm by early next week.
Several models are showing this system rapidly developing into a hurricane, possibly a strong hurricane, by the middle of the week. Models also show that the possible hurricane would likely recurve back eastward before it ever came close to land.
It has been a quiet start to the hurricane season in the Atlantic, but we are nearing the peak of the season, so we’ll probably start to see things picking up soon.
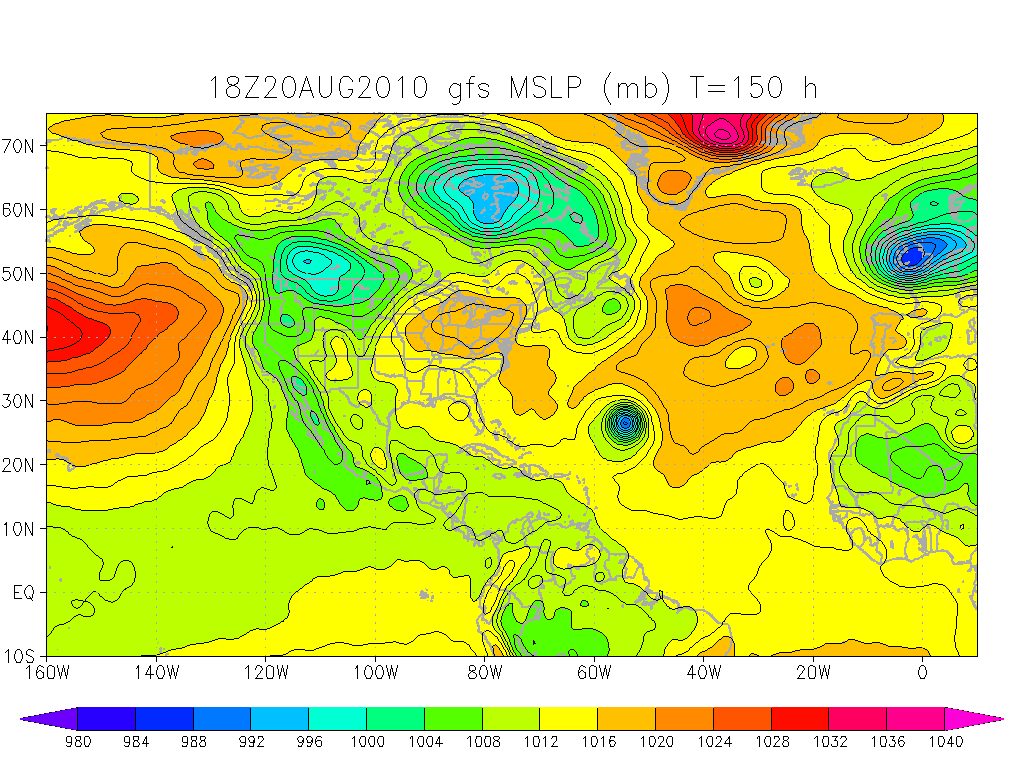
Sea-level pressure, GFS model, valid for 00Z on the 27th (Thursday night). Note the area of low pressure in the Atlantic. Click to enlarge.
Permalink
08.18.10
Posted in Weather News at 4:11 pm by Rebekah
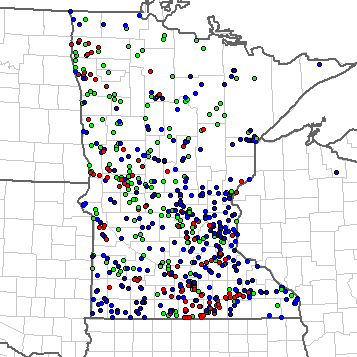
Minnesota has reported 123 tornadoes so far this year, more than any other state.
Texas comes in second, with 87 reported tornadoes.
Annual Severe Weather Report Summary – 2010, Minnesota. Red dots are tornado reports, green hail, wind blue. Courtesy of the SPC.
The most tornadoes in a year in recorded history in Minnesota was 74 in 2001. Not all of these 123 reports will be confirmed as tornadoes; generally the official tornado count is somewhat less than the number of reports, due to multiple reporting of the same tornado or mistakenly reporting a suspicious-looking cloud as a tornado. However, once the National Weather Service completes damage surveys and releases the official numbers next year, 2010 is likely going to break the record for most number of tornadoes in a year in Minnesota (in recorded history).
It is interesting to note that most of these tornadoes came on just a handful of outbreak days, most notably including June 17th (40+). June 17th also broke the record for the most tornadoes in a day in Minnesota history. The previous record was 27 tornadoes on June 16, 1992. Currently, 27 tornadoes have been confirmed with another 15+ likely to be confirmed at a later date. (See NWS Twin Cities report on the event for more.)
One of the reasons for increased tornado reports is the increased number of chasers and spotters observing storms. Also, the storm season didn’t really get going in the Southern Plains until mid- to late April; and by June, the storms had mostly shifted to the Northern Plains (and the season’s still going up there!).
In other news, the U.S. is finally back near the 5-year average for the number of tornado reports.
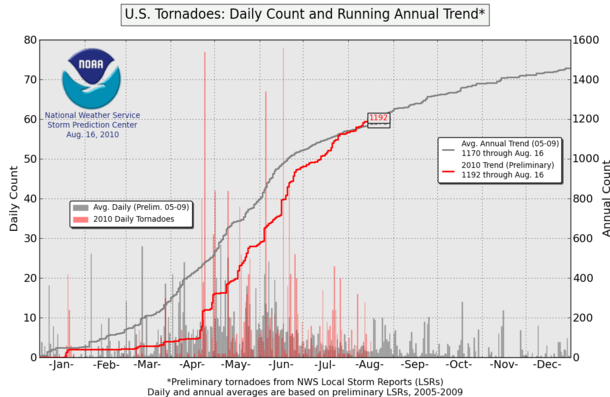
The following plot shows the 2010 running count for tornado reports (remember, the actual number of tornadoes will be less) as compared to the 5-year average annual trend (gray line). The plot also shows the 2010 count and the average count for every day (outbreak days are pretty obvious).
U.S. Tornadoes: Daily Count and Running Annual Trend. Courtesy of the SPC.
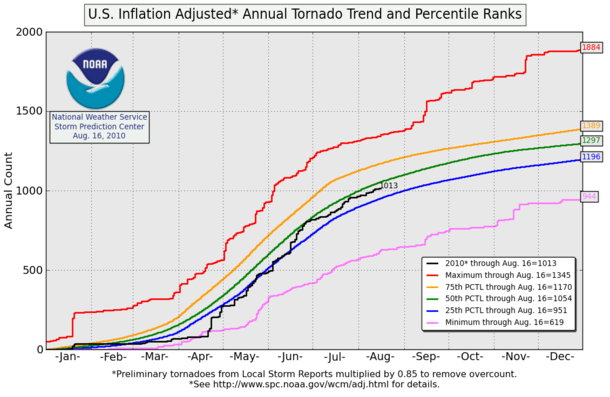
See also the annual tornado trend and percentile ranks as well (below). This plot has been adjusted to account for the overcount of tornadoes (hence “inflation adjusted”). As you can see, we are near the 50th percentile so far (i.e., near average, as the above plot showed too).
U.S. Inflation Adjusted Annual Tornado Trend and Percentile Ranks. Courtesy of the SPC.
Compare these plots with the plots I posted on the blog earlier this year:
April 14: Where Have All The Tornadoes Gone? – (and to think that I was concerned about the lack of tornadoes and chasing opportunities in mid-April…)
May 22: Tornado Season So Far…
For more tornado stats by state and to see what the top 10 active tornado days have been in the U.S. this year, see the SPC’s Annual Weather Report Summary.
Permalink
08.17.10
Posted in Non-US Weather, Weather News at 2:21 pm by Rebekah
This week’s post in the global weather and climate series features Suva, Fiji.
-
-
-
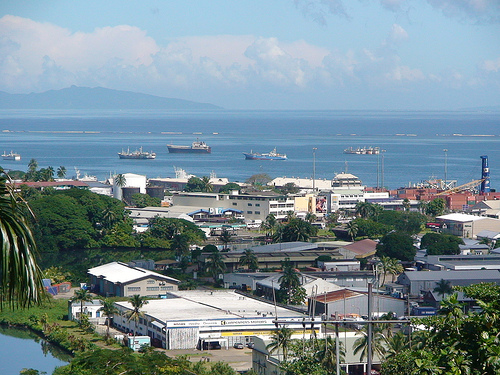
Walu Bay Industrial Zone, Suva City, Fiji. Courtesy of Wikipedia.
Last week we took a look at the weather and climate on the Galápagos Islands, in the east central Pacific Ocean. Today we’ll contrast that with the weather and climate of Fiji, in the south west Pacific Ocean.
The Republic of the Fiji Islands are an archipelago of over 332 islands and over 500 islets, amounting to over 7000 mi² of land. Fiji’s population is 849,000, but 87% of the people live on the two largest islands, Viti Levu and Vanua Levu. Fiji is located about 1200 miles northeast of New Zealand’s North Island. The islands are mountainous, with peaks over 4000 feet. Dependent on tourism and sugar exports, Fiji is also a producer of timber, fish, gold, copper, and oil.

Monuriki Island, Mamanuca archipelago, Fiji. Courtesy of Wikipedia.
Suva is the capital of Fiji, found on the island of Viti Levu. Also the largest city in Fiji and in the South Pacific, Suva is home to nearly 86,000 people (over 172,000 in the metro). Suva is situated on a peninsula and has mountains to the north and west, allowing the southeast trade winds to produce rain year round.
A few more facts about Suva (courtesy of Wikipedia):
- Time zone: Fiji Standard Time (UTC+12)
- Elevation: 0 to 25 ft above mean sea level
- Climate zone: Tropical rainforest
- Average high temperature: 84 °F (29 °C)
- Average low temperature: 68 °F (20 °C)
- Record high temperature: 99 °F (37 °C)
- Record low temperature: 55 °F (13 °C)
- Average annual precipitation: 117 inches (2,980 mm)
Like Puerto Ayora in the Galápagos Islands, temperature only varies by a few degrees throughout the year in Suva. The average high in Suva is only a few degrees above the average high in Puerto Ayora, and the average lows of both cities are the same.
Also like Puerto Ayora, Suva tends to be warmer and wetter from December to May and cooler and drier from June to November.
However, unlike Puerto Ayora, Suva receives copious rainfall; in fact, Suva receives about 13 times as much rain as Puerto Ayora!
Both cities are located on the coast of an island in the tropical Pacific (Suva is at about 18°S, while Puerto Ayora is nearly on the equator), but the big difference comes in the location of each island.
The western Pacific receives more rain than the eastern Pacific for numerous reasons, including more hurricanes in the western Pacific and prevailing wind direction. Easterly trade winds push warm water (and warm, moist air) towards the west, while cold water wells up from beneath the surface (to replace the surface water that’s been pushed west) on the west tropical coast of South America. Water temperature greatly affects air temperature in the tropics, so temperatures will tend to be a little cooler (and air drier) on the eastern edge of an ocean basin and vice versa on the western edge. As mentioned above, Suva is also moist because it is on the southeast coast with mountains to the north and west, so the southeast trade winds bring moisture right into the area. The northwest coasts of Fiji islands are much drier.
Current weather: Rain showers, with highs in the mid-80s and lows near 70 °F.
For more information on Suva, here’s a link to Wikipedia. For more information on Fiji, here’s another link to Wikipedia.
For weather maps and information on current and forecast Fiji weather, see the Fiji Meteorological Service (check out their hand-drawn weather maps), WeatherZone (Australian weather site with weather info for all over the world) and Weather Online UK (collection of maps and weather information for all over the world).
Next Tuesday we’ll look at the weather in Antarctica. As always, if you have any comments or suggestions for future cities, please leave a comment on this post!
Permalink
« Previous Page — « Previous entries « Previous Page · Next Page » Next entries » — Next Page »


