05.25.10
Posted in Non-US Weather, Weather News at 4:47 pm by Rebekah
After taking a 6-week break in my global weather and climate series, in order to focus on work and posts on storm chasing, I’m finally coming back to the series.
Here’s what continents I’ve done so far (my goal was to pick a different continent each week, cycling through all seven for as long as there is interest in the series).
#1 – Australia (Perth, Australia)
#2 – Europe (Edinburgh, Scotland)
#3 – South America (Rio de Janeiro, Brazil)
This week, for the fourth post in the series, I will take a look at Kochi (formerly known as Cochin), India.
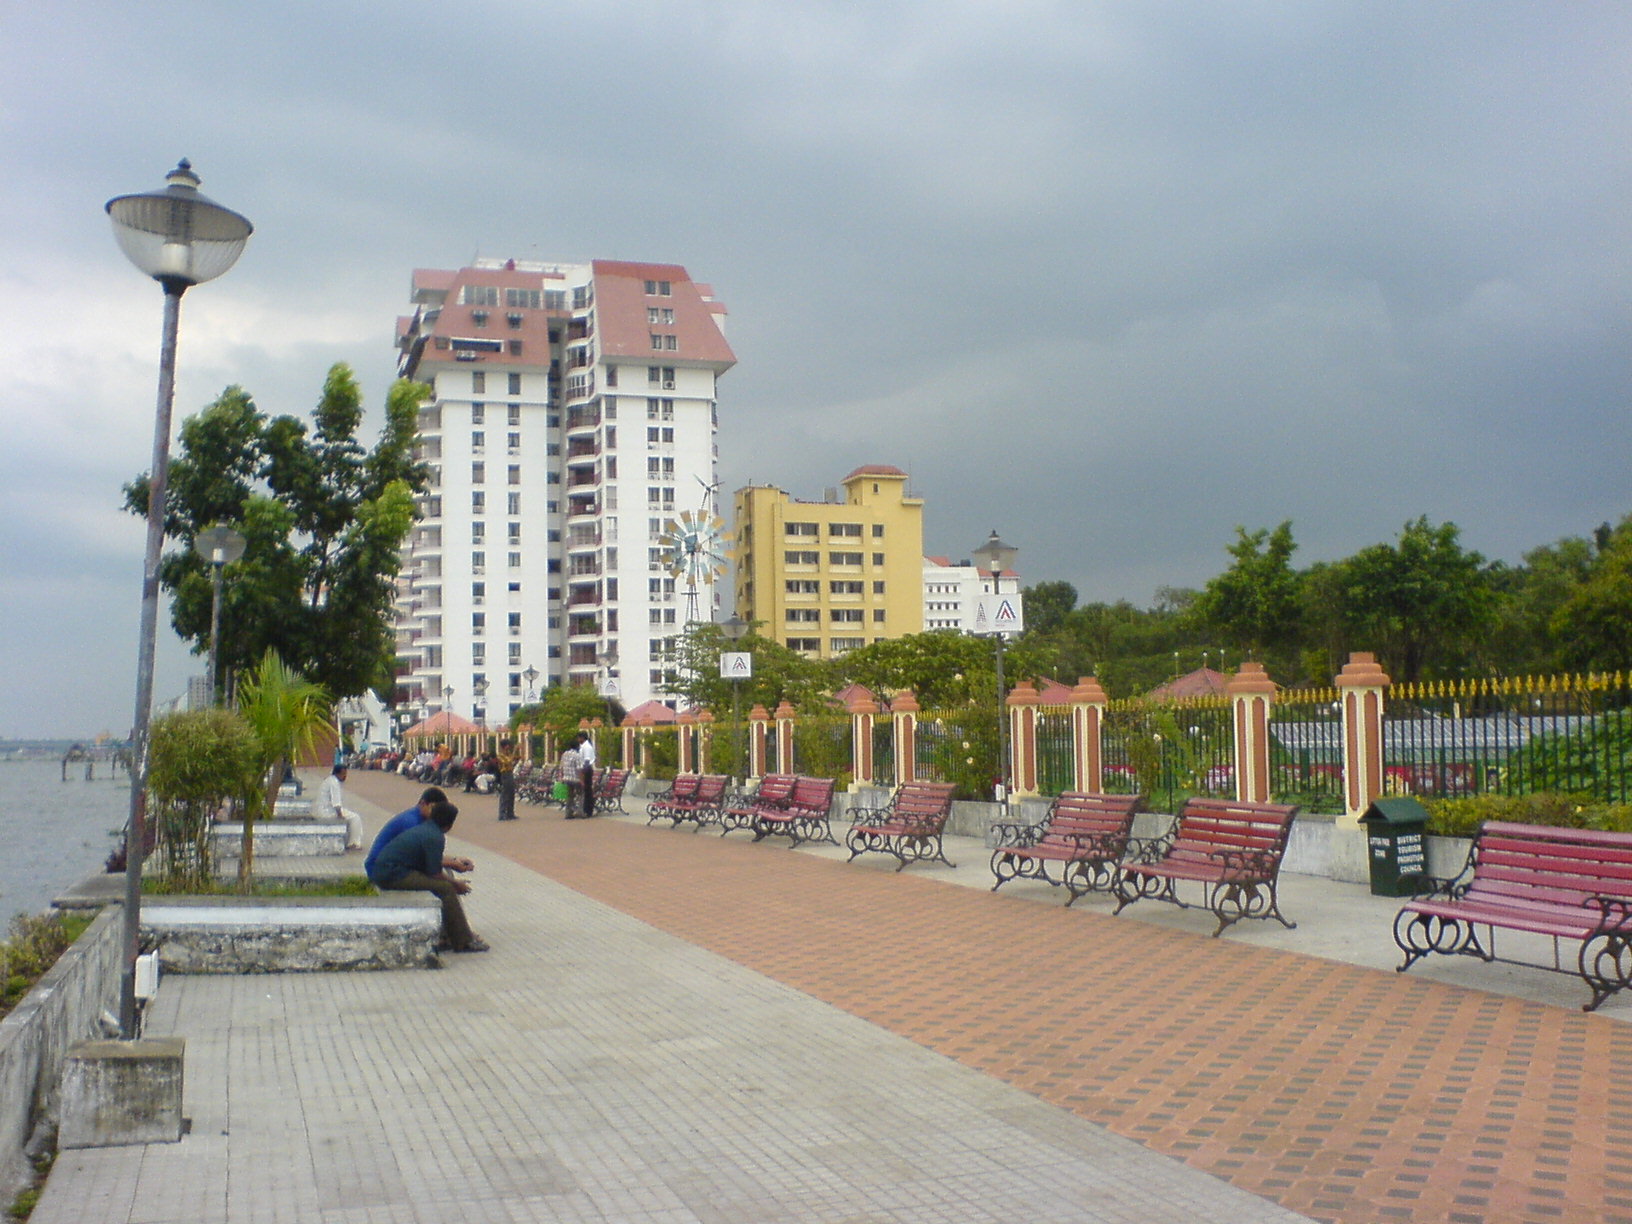
Kochi, India (image courtesy of Wikipedia).
Located in southwest India, on the coast of the Arabian Sea, Kochi is home to about 600,000 people (approximately 1.5 million in the metro). Kochi, sometimes known as the “Queen of the Arabian Sea”, has long been one of the most important spice trading centers on the Arabian Sea. As the first European colonial settlement in India, Kochi was the capital of Portuguese India for nearly 30 years in the early 16th century. Growth in shipping industries, tourism, and information technology have continued to boost Kochi’s economic growth.
A few more facts about Kochi (from Wikipedia; some weather data from Weatherbase):
- Time zone: India Standard Time (UTC+5:30)
- Elevation: 0 ft above mean sea level
- Climate zone: Tropical monsoon (hot/wet summers, warm/moist winters)
- Average high temperature: 86 °F (30 °C)
- Average low temperature: 77 °F (25 °C)
- Record high temperature: 100 °F (38 °C)
- Record low temperature: 63 °F (17 °C)
- Average annual precipitation: 108 inches (2,740 mm)
The forecast for Kochi this week is thunderstorms every day with highs in the low to mid-80s and lows in the mid- to upper 70s. Why is it so stormy? Note also that Kochi receives over 100 inches of rain per year, and most of that rain comes during the summer months (June to September).
A seasonal shift in winds, resulting in a seasonal shift in precipitation, is called a monsoon.
Put most simply, water has a higher heat capacity than land, so in the summertime, the Indian peninsula heats up more than the surrounding water. This warmer region of air starts to rise (often aided by the Himalayas), creating a low pressure system. The low pressure, in turn, draws the moist air from the sea in towards the land, thus allowing many thunderstorms to form and much rain to fall (see figure below).
In the wintertime, the land cools down faster than the water. A surface high pressure system forms over the land, and blows air out to sea, keeping India drier than it would be otherwise (see figure below).
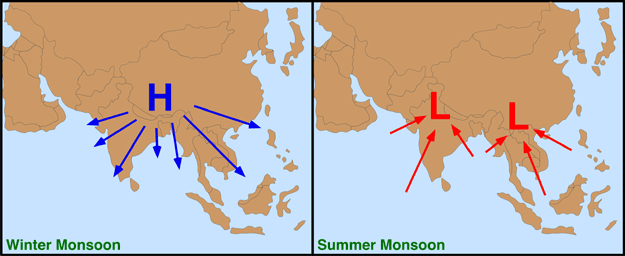
Winter and summer monsoon patterns for southeast Asia (courtesy of physicalgeography.net).
The following figure illustrates the approximate dates for the southwest summer monsoon to arrive at different regions of India.
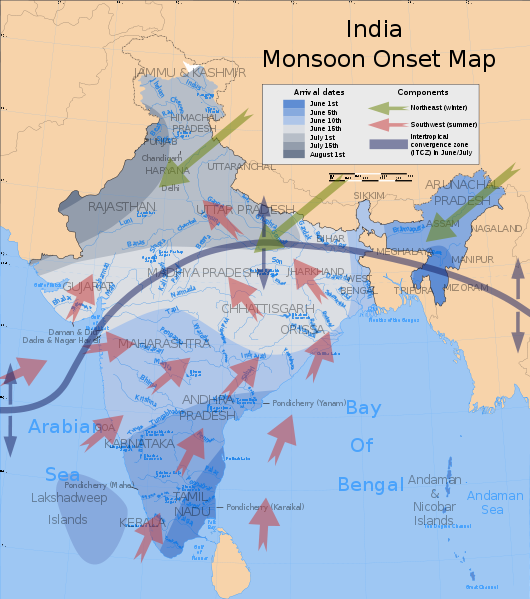
Southwest summer monsoon onset map (courtesy of Wikipedia).
As you can see, the monsoon should soon be arriving at Kochi (Kochi is in the state of Kerala). The India Meteorological Department (IMD) posted the following Monsoon Watch last night:
“The Northern limit of Monsoon (NLM) continues to pass through Lat.5.0°N/ Long.70.0°E, Lat.5.0°N/ Long.75.0°E, Lat. 8.0°N/Long. 80.0°E, Lat. 12.0° N/ Long. 84.0°E, Lat. 15.0° N/ Long. 87.0°E, Lat. 18.0° N/ Long.90.0°E and Lat. 21.0° N/ Long. 93.0° E.”
Note that Kochi is located at about 10°N and 76°E, meaning the northern edge of the monsoon is just a few degrees south and east of Kochi at this time.
I have heard some predictions that the monsoon should be getting off to a good, rainy start this year (more so than last year, anyway), especially as there is currently a heat wave going across northern, western, and central India with temperatures peaking at about 50°C (122°F).
Weather Trends International has some information on the monsoon outlook, as well as some maps showing forecast precipitation totals by month.
For more information on Kochi, here’s a link to Wikipedia.
For weather maps and information on current and forecast Kochi weather, see the India Meteorological Department (don’t worry, it’s in English!) or Weather Online UK (great collection of weather maps and models for all over the world).
Next Tuesday I plan to take a look at the climate and weather in another part of the globe. We still have North America, Africa, and Antarctica before starting over again. As always, if you have any comments or suggestions for future cities, please leave a comment on this post!
Permalink
05.22.10
Posted in Weather News at 3:31 pm by Rebekah
Just over a month ago, I posted on the unusual lack of tornadoes through mid-April. As expected, however, shortly after that post, there was an explosion in this year’s tornado count.
Here’s how we stand through Thursday, May 20 (does not include the 5 tornado reports from yesterday).
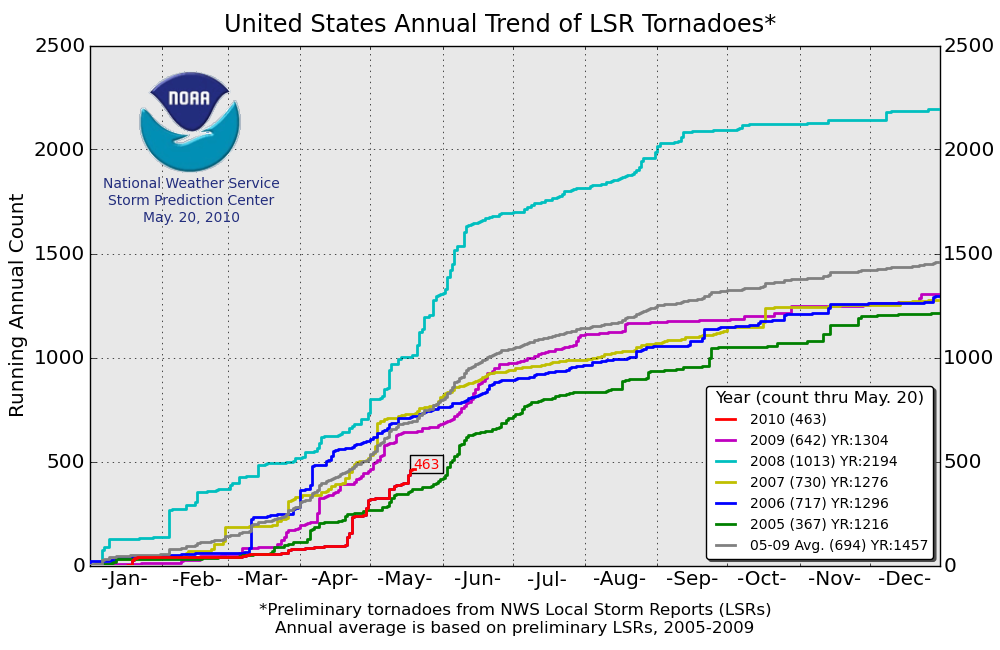
This graph (click to enlarge) from the Storm Prediction Center shows the trend in local storm reports (LSRs) of tornadoes in the U.S. LSR values may be slightly higher than the actual tornado count, as some tornadoes may have been reported more than once.
The next graph, also from the Storm Prediction Center, shows annual tornado trends and percentiles; calculation details are at the website at the bottom of the figure. The red line is the maximum tornado count in a single year and the pink line is the minimum tornado count in a single year. The other lines show tornado trends in quartiles.
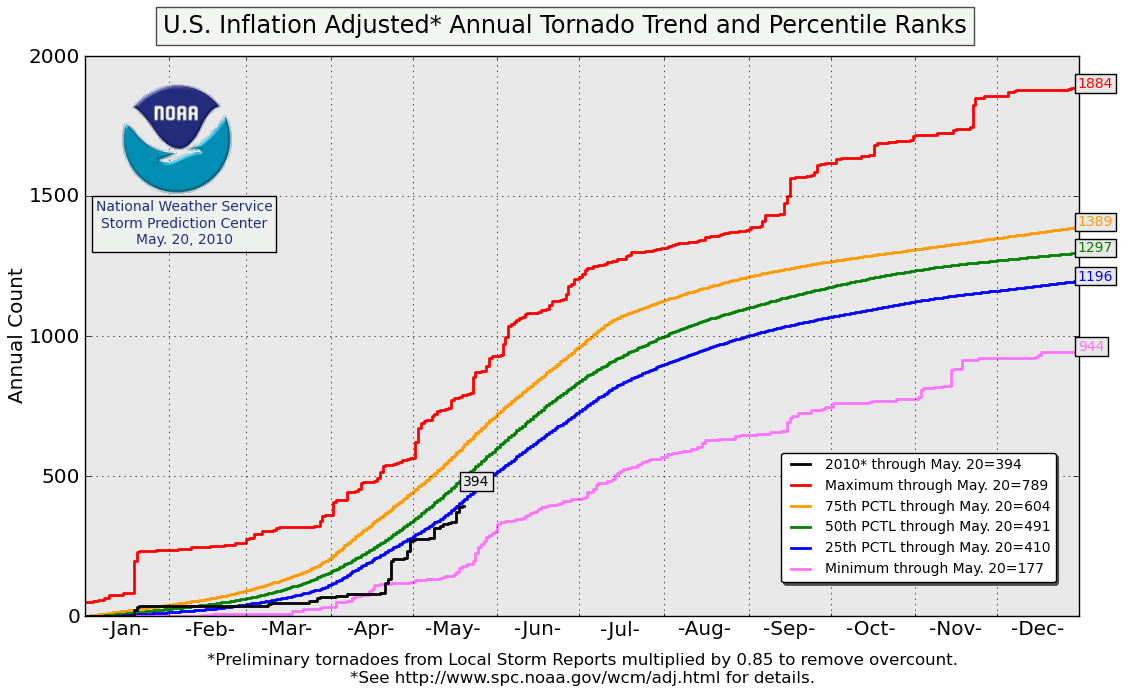
Note that after briefly dropping below the all-time minimum, this year’s tornado count quickly jumped up in late April, and we’re now approaching the 25th percentile.
Although it looks like we’ll be getting a big ridge over the central US this coming week, inhibiting widespread severe storms for at least the next couple of weeks (though there are still likely to be localized areas with severe weather), the storm season is not over yet. There is usually a ridge that comes for a week or two in May, before another peak in tornado season comes in early or mid-June across the Central to Northern Plains.
Permalink
05.18.10
Posted in General News, Weather News at 8:52 am by Rebekah
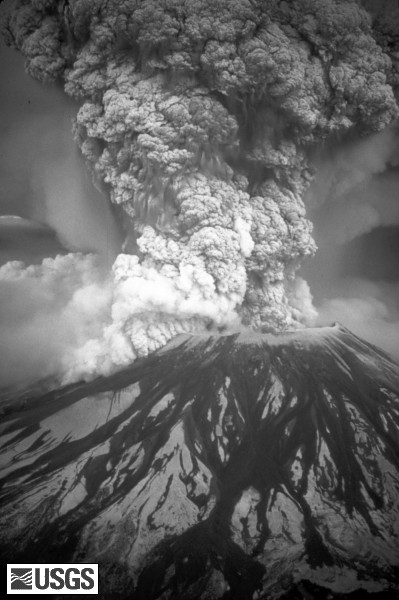
Today is the 30th anniversary of Mount St Helens’ catastrophic eruption.
On May 18, 1980, the Washington State volcano shot ash 12 miles up into the atmosphere (see satellite image from GOES-3, below, taken at 8:45 am PDT, courtesy of Wikipedia). In about two weeks, the ash had circled the globe.
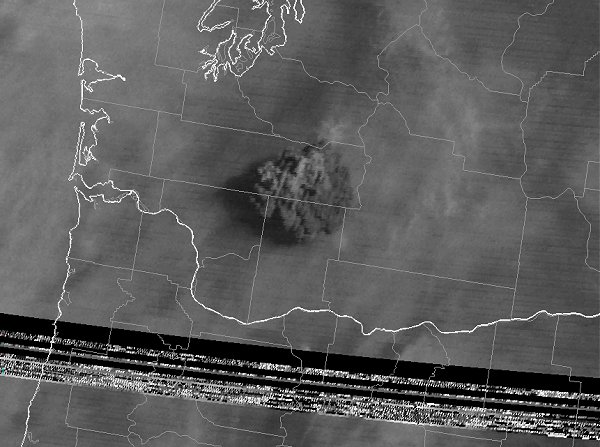
For more information on Mt St Helens’ eruption, see the Wikipedia article and the Mt St Helens website. The Mt St Helens volcano cam may be showing a commemoration event today.
Volcanoes can affect weather and climate; in some cases, volcanic eruptions have been associated with cooler temperatures (sulfuric acid can block some sunlight from reaching the Earth). It will be interesting to see if the recent eruptions of the Icelandic volcano Eyjallajökull have any effect on European temperatures in the near future.
Speaking of the Icelandic volcano, continued eruptions and northwest winds have prompted more flight cancellations in Europe recently. However, it appears that the upper-level winds are changing, and Europe should be okay for a little while again…
Permalink
05.17.10
Posted in Weather News at 9:40 pm by Rebekah
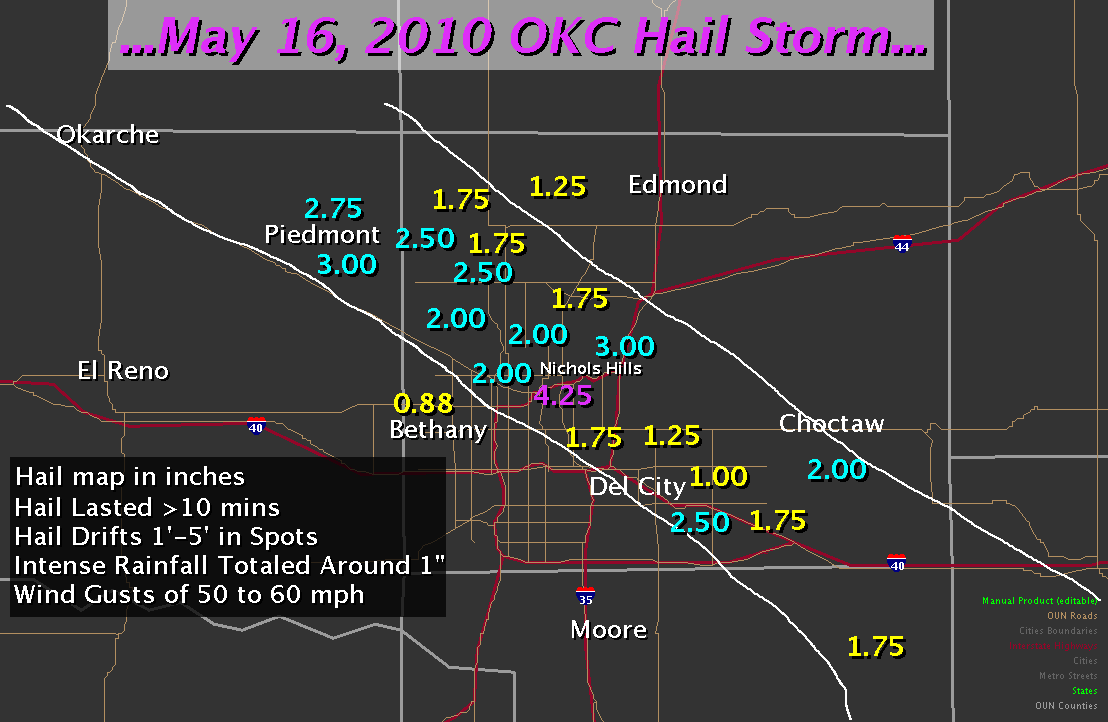
Here’s a map the NWS constructed of the hail swath through Oklahoma City yesterday.
We were just south of the 4.25″ report, near the one that shows 1.75″–though our hail was only 1″ at the very largest.
The NWS has more information on the storm setup and hailstorm on this website.
Permalink
05.14.10
Posted in Severe Weather Post-analysis, Weather News at 1:36 pm by Rebekah
Updated as of 3pm…two upgrades to EF4!
On Monday, while I was up gallivanting around northern Oklahoma, there were two EF4 tornadoes that occurred within a 5-mile radius of my apartment! Looking even farther out, there were twoEF3 and two EF4 tornadoes that occurred within about a 30-mile radius of my apartment, and roughly ten tornadoes that occurred within that same radius.
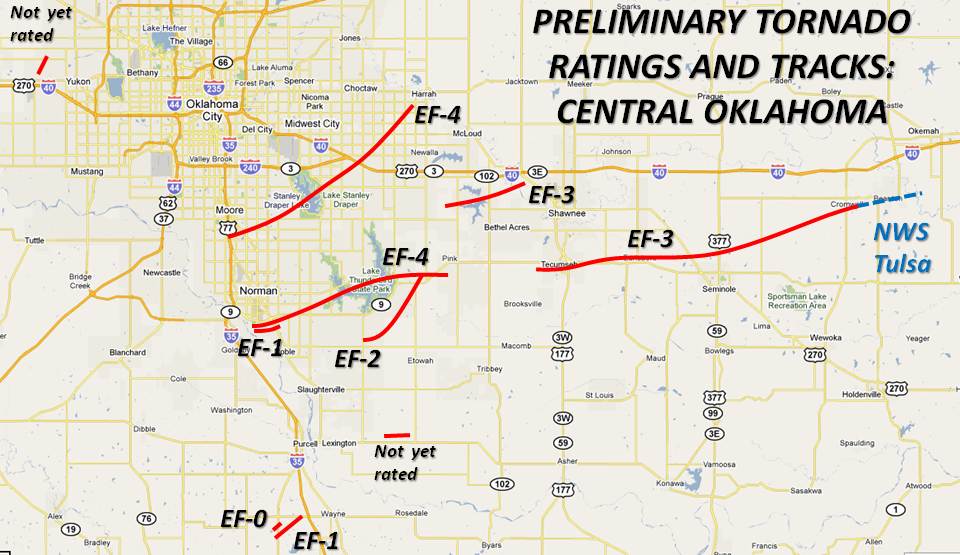
The National Weather Service is still working on damage surveys following Monday’s tornado outbreak, but as of this morning, here’s a map of the tornadoes (click to enlarge) that occurred around central Oklahoma. Note the EF4 that passed over south Norman and Lake Thunderbird formed right around the National Weather Center. Yikes!
Tomorrow I hope to spend some time compiling some information on the outbreak and doing a post-storm analysis of the day. Once I get that together, I’ll make a webpage for it and post the link. For now, the National Weather Service in Norman has some good information, mostly on the tornado tracks (but it’s being updated pretty frequently), on their website, so you can check that out if interested in where some of the other tornadoes occurred and what they were rated.
The top rated tornadoes were EF4 (meaning the strongest tornadoes of the day passed through south Norman and Moore).
Later this afternoon and evening I plan on posting some photos and possibly video from Monday’s chase in northern Oklahoma, as well as a chase log and a few photos from Wednesday’s chase (long story short–saw an impressive tornadic supercell near Clinton, but didn’t see the tornado).
Permalink


