04.30.10
Posted in Weather News at 11:16 pm by Rebekah
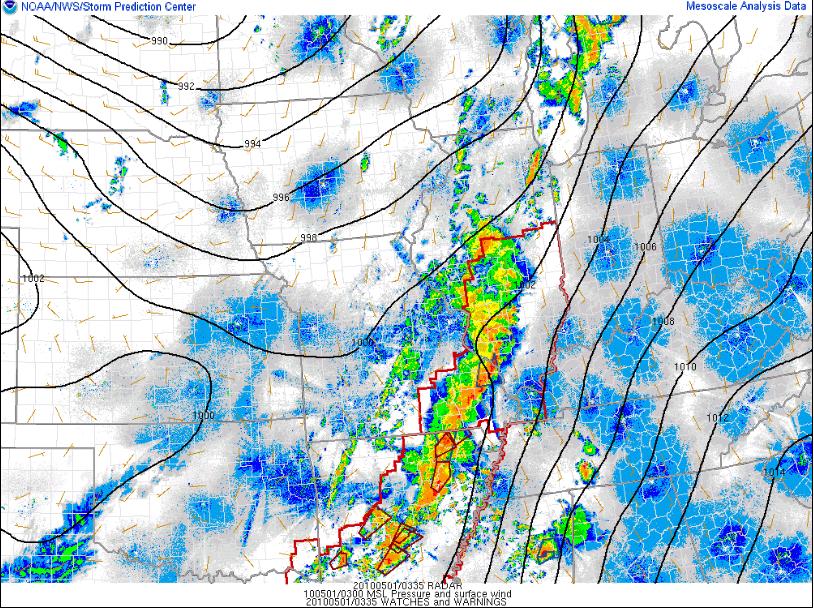
The Storm Prediction Center started off the morning by issuing a Slight Risk for severe thunderstorms, but has since upgraded to a High Risk, centered in Arkansas.
A line of supercells, now merging into more of a squall line, is marching across parts of the Midwest into the Mississippi River Valley area, putting down numerous tornadoes from Wisconsin to Arkansas (see the radar image, above; tornado warnings are small red boxes, while tornado watches are larger red boxes and severe thunderstorm warnings are are in blue).
Ample CAPE and wind shear have been conducive to rotating storms in this general area, along a cold front, for most of the afternoon.
Sadly, there have already been reports of deadly tornadoes in Arkansas. Tomorrow, the storms will progress towards the Southeast, giving the already tornado-weary Mississippi and Alabama another chance for severe storms.
The low that is responsible in part for this severe weather may be the last one we see for a while, on the Plains anyway. Models for at least the next week show primarily zonal flow across the US, meaning no big troughs to assist in producing strong thunderstorms.
Right in time for VORTEX2, which starts up tomorrow…
Permalink
04.14.10
Posted in Weather News at 9:38 pm by Rebekah
Mid-April in Tornado Alley. Only 93 tornado reports so far.
Over the last 30 years, there were on average 191 tornadoes between January 1 and April 15.
Over the last 10 years, there were on average 237 tornadoes.
Over the last 5 years, there were on average 338 tornadoes.
Tornado reports have, on average, gone up over recent years, but that is due in large part to increased tornado awareness, increased storm chasers and spotters, and increased tornado detection through Doppler radar.
But that’s not the point.
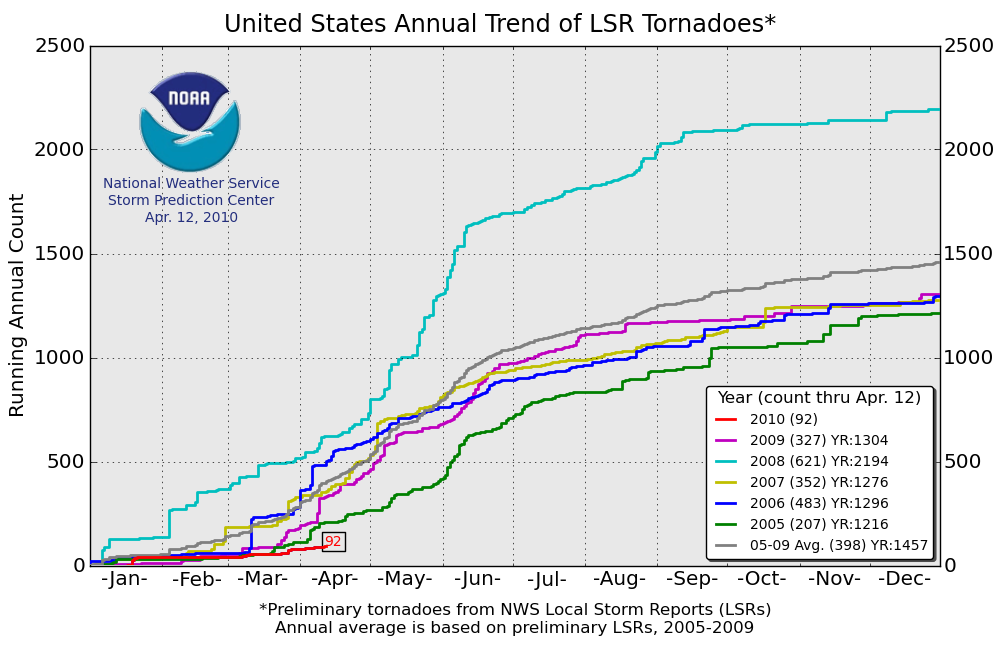
The point is that this year is below average. Take a look at the plot below, from the Storm Prediction Center. This graph shows the trend in local storm reports (LSR) of tornadoes in the U.S. Values may be a little higher than the actual tornado count (some tornadoes may have been reported more than once). The last five years are shown, as well as the current year up through April 12.
Now look at the graph below (click to enlarge), also from the Storm Prediction Center. This plot shows annual tornado trends; if you’re curious as to how exactly the trends were calculated, see the website on the bottom of the figure. Basically, the red line is the maximum tornado count in a single year and the pink line is the minimum tornado count in a single year. The other lines show tornado trends in quartiles. Currently, 2010 is in the all-time lowest 25th percentile, near the minimum. That’s how slow this year is in terms of storms and tornadoes.
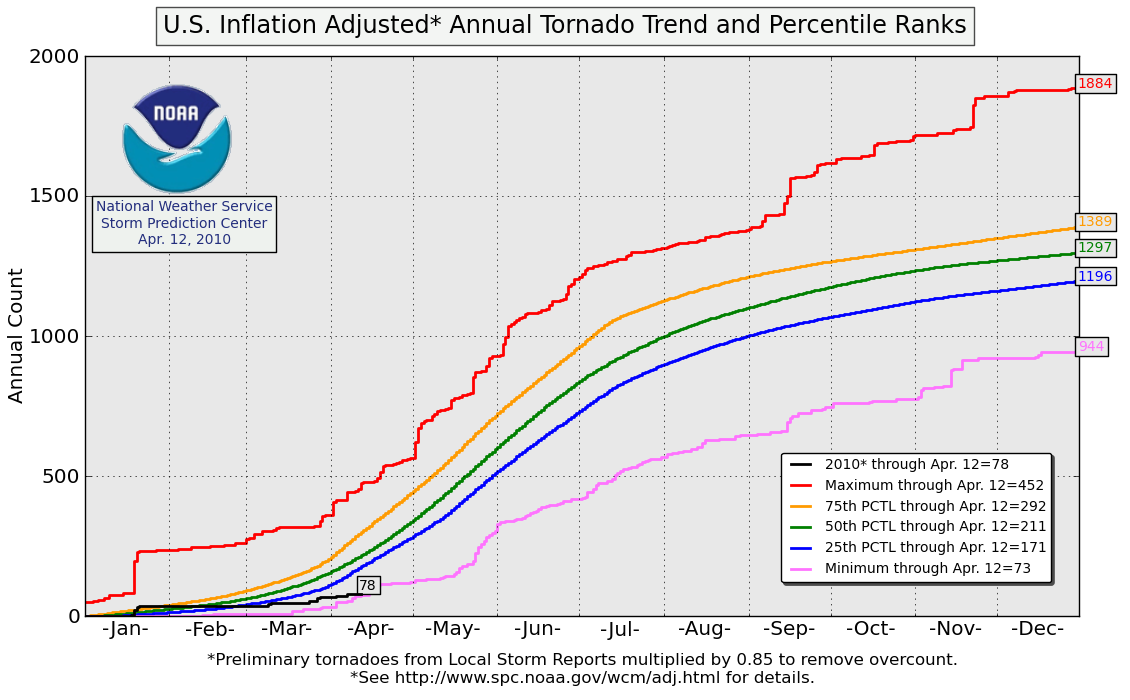
One thing to note, however, is that in 2004, there was an all-time record of over 1800 tornadoes in the U.S. From January 1 to April 15 of 2004, only 91 tornadoes were reported. As of today, April 14, 2010, 93 tornadoes have been reported this year.
Currently the weather pattern over much of the U.S. is more summer-like than spring-like, with few good troughs digging into the central or southern Plains…however, all this just goes to show that storm chasers shouldn’t be too worried about this season yet (and sane citizens of the Plains shouldn’t get too excited yet)…
Permalink
04.13.10
Posted in Non-US Weather, Weather News at 5:19 pm by Rebekah
This week’s featured city, in my series on global weather and climate, is Rio de Janeiro, Brazil.

Rio de Janeiro, Brazil. Courtesy of Wikipedia. Click to enlarge.
Located in southeast Brazil, on the Atlantic Coast, Rio is home to about 6.2 million people (approximately 14.5 million in the metro). Rio de Janeiro, Portuguese for “River of January”, was the capital city of Brazil until 1960, when Brasília became the capital. Near the Tropic of Capricorn, Rio is the main tourist destination in the Southern Hemisphere and will host the final match of the 2014 FIFA World Cup and the 2016 Summer Olympics (the first city to host the Olympics in South America).
A few more facts about Rio de Janeiro (from Wikipedia):
- Time zone: Brasília Standard Time (UTC-3) or Brasília Daylight Time (UTC-2)
- Elevation: 0 to 3,350 ft above mean sea level
- Climate zone: Tropical savanna (hot/wet summers, mild/dry winters)
- Average high temperature: 86 °F (30 °C)
- Average low temperature: 68 °F (20 °C)
- Record high temperature: 109 °F (43 °C)
- Record low temperature: 45 °F (7 °C)
- Average annual precipitation: 43 inches (1,090 mm)
Recent/current weather: Last week Rio de Janeiro and surrounding areas were hit hard by heavy rains; reportedly the heaviest rain in nearly 50 years. Rio de Janeiro received about 11 inches of rain within 24 hours on Tuesday/Wednesday. Massive flooding and landslides have sadly resulted in the deaths of over 200 people, and have left thousands without homes.
What caused the rain? One big reason has to do with the low-pressure system sitting off the southern Brazilian coast last week (see figure, below). In the Northern Hemisphere, low pressure turns counter-clockwise and high pressure turns clockwise; however, in the Southern Hemisphere, low pressure turns clockwise and high pressure turns counter-clockwise. Thus the strong low-pressure system produced southerly and southeasterly winds in the Rio area, bringing a lot of tropical, moist air from the south Atlantic onshore. Steep terrain around Rio de Janeiro also contributed to the rainfall, as warm, moist air can produce clouds and rain as it rises up a hill or mountain.
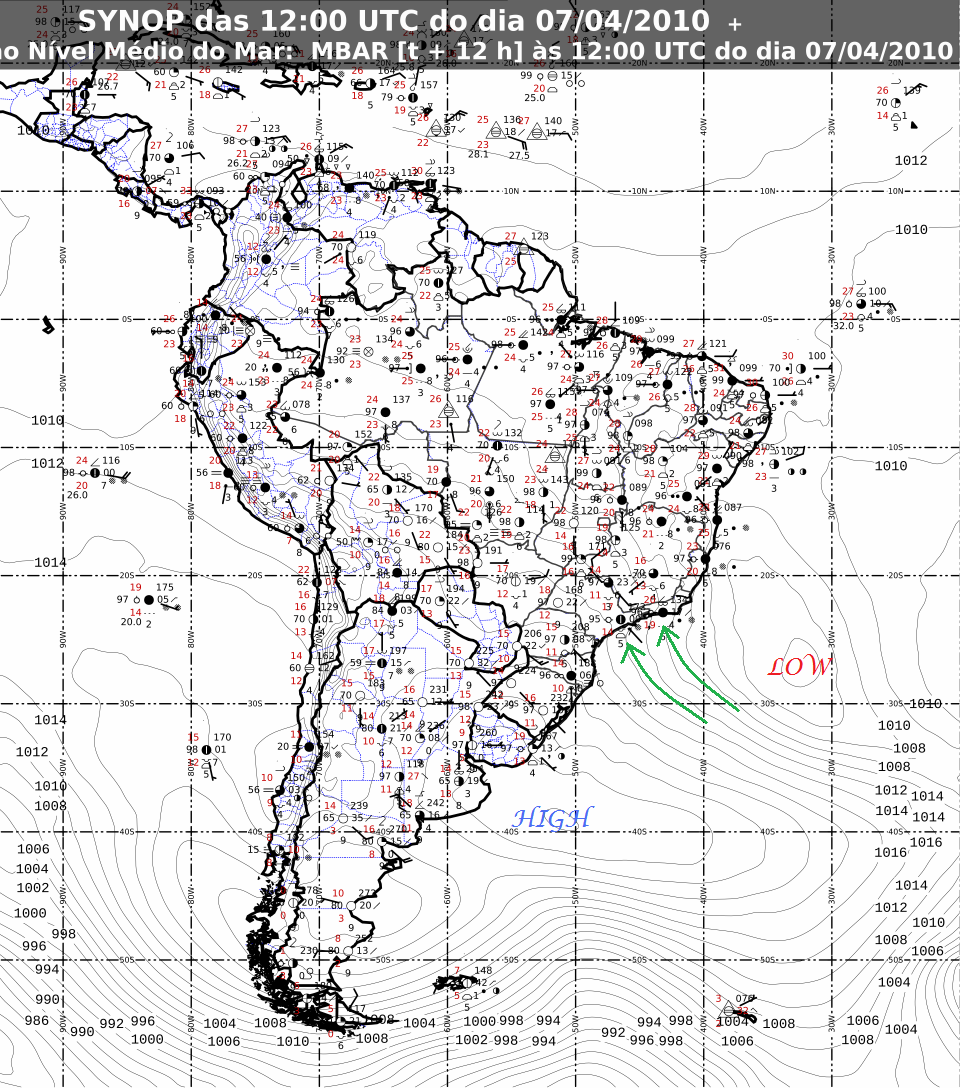
Surface analysis of South America on 7 April 2010, at 12Z (9am Rio de Janeiro time). Map courtesy of INMET. Note the 1004 mb closed low off the coast of Brazil, and the 1028 mb closed high off the coast of Argentina. Green arrows denote approximate wind direction. Click to enlarge.
As the low left the area, it was replaced by a high, which is bringing more easterly winds to Rio (this is the typical wind direction in the tropics). As Rio de Janeiro’s coast primarily runs east/west, these easterly winds are assisting in producing some rain, but not nearly as heavy of rain as was associated with the low. In addition, highs are associated with sinking air, so naturally there should not be as much rain.
For more information on Rio de Janeiro, here’s a link to Wikipedia.
For weather maps and information on current and forecast Rio de Janeiro weather, see the Instituto Nacional de Meteorologia (INMET, i.e., Brazil’s National Institute of Meteorology — warning, it’s in Portuguese!) or Weather Online UK (great collection of weather maps and models for all over the world).
Next Tuesday I’ll take a look at the climate and weather in another part of the globe. As always, if you have any comments or suggestions for future cities, please leave a comment on this post!
Permalink
04.01.10
Posted in Severe Weather Forecast, Weather News at 3:08 pm by Rebekah
Here we go!
Oklahoma dewpoints are finally in the mid-50s; some dewpoints in western Oklahoma are already up to 60 today, ahead of a dryline. Note the surface map below (click to enlarge), as of 2:50pm, from the Oklahoma Mesonet.
As the legend shows, dewpoint is the number in green. The higher the dewpoint, the more moisture there is in the air. For thunderstorms, especially severe thunderstorms, chasers often look at 60 °F as the magic number.
Note that in the panhandle, dewpoints are in the teens — this is because there is a dryline in the panhandle, or a line where dewpoints are low on one side (with winds usually from the west) and high on the other side (with winds usually from the south or southeast). Temperature is given in the red numbers, while the staffs/barbs at each station indicate wind direction (mostly from the south in this case) and speed (based on number of barbs on the staff).
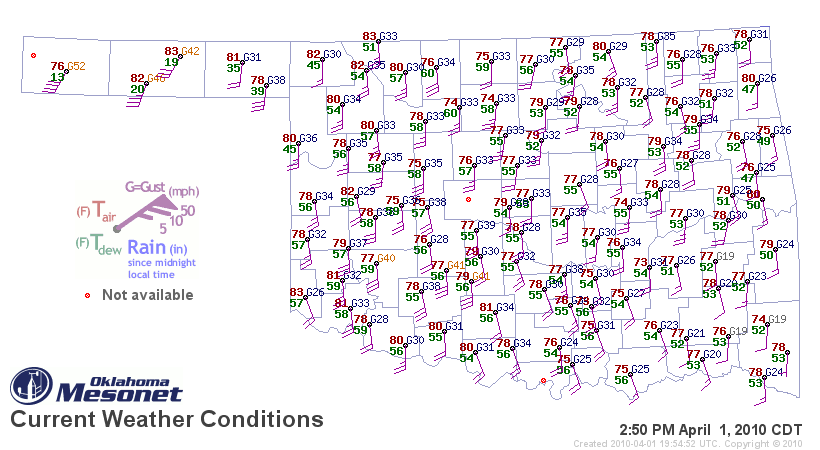
There is a slight risk of severe thunderstorms today in western Oklahoma, but the cap (temperature inversion that acts as a “lid” to rising air) is so strong it is unlikely that much of anything will break through it.
Tomorrow there is also a risk of severe weather, but primarily east of here. The next time I go chasing may be early next week, as it looks like we will not only have a decent trough, but also finally have the moisture and instability we’ve so desperately needed. The actual day and location is still rather up in the air, but as the models start to resolve the details of the setup, I will begin to have a better idea.
Stay tuned…
Permalink
03.30.10
Posted in Non-US Weather, Weather News at 9:48 am by Rebekah
Last Tuesday I started a series of posts on global weather, focusing on current weather and climate of places around the world. The inaugural post took a look at Perth, Australia.
This week’s featured city is Edinburgh, Scotland, in the United Kingdom.

Edinburgh, Scotland. Courtesy of Wikipedia.
Situated in southeast Scotland, near the North Sea, Edinburgh is home to nearly 500,000 people (about 1.2 million in the metro). Edinburgh is the capital of Scotland and the second most popular tourist destination in the UK, behind London. A few facts about Edinburgh (climate data from Weatherbase):
- Time zone: Greenwich Mean Time (UTC+0) or British Summer Time (UTC+1)
- Elevation: ~135 ft above mean sea level
- Climate zone: Maritime (warm/moist summers, cool/wet winters)
- Average high temperature: 53 °F (11 °C)
- Average low temperature: 41 °F (5 °C)
- Record high temperature: 88 °F (31 °C)
- Record low temperature: 1 °F (-17 °C)
- Average annual precipitation: 26 inches (663 mm)
Current weather: This afternoon it is raining in Edinburgh, with a temperature of 38 °F (3.2 °C) as of 3pm local time. The pressure is 987 mb and falling. Not far north of the city it is snowing, and as cold air surges southward, the snow is expected to be heavy over parts of Scotland and Ireland.
The following shows a radar image (from the UK Met Office) at 3pm local time:
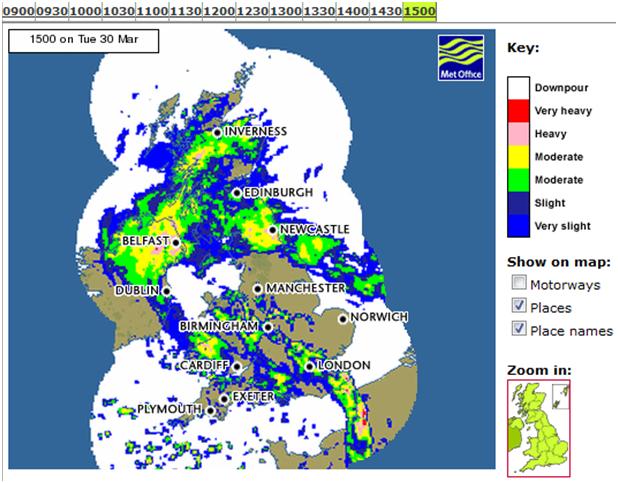
This rain and snow is associated with an extratropical cyclone that is making landfall on the Irish and British coasts. I can’t find any very good current surface maps of the UK, but here’s a 9-hr model run (initialized at 06Z and valid at 15Z, or 3pm local time), showing surface pressure contours (from Weather Online UK).
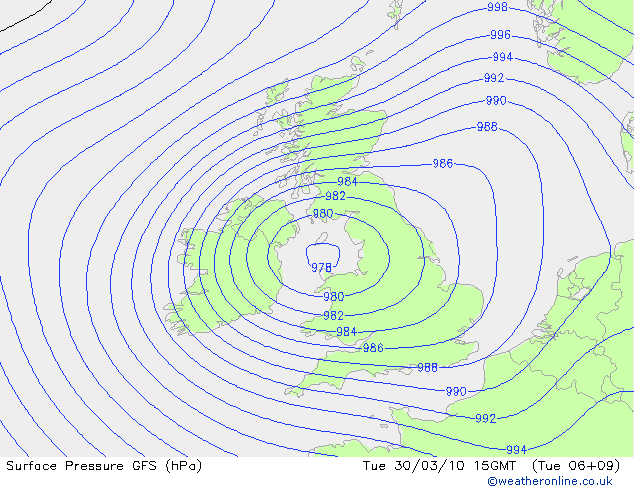
There is a pretty tight pressure gradient with this storm system, so not only will it bring sub-freezing temperatures to Scotland, but it will bring strong winds (roughly 35 mph in Scotland, 40 to 50 mph in western Scotland and northern Ireland, with gusts to 82 mph) that will blow the snow around and cause blizzard conditions in much of the country.
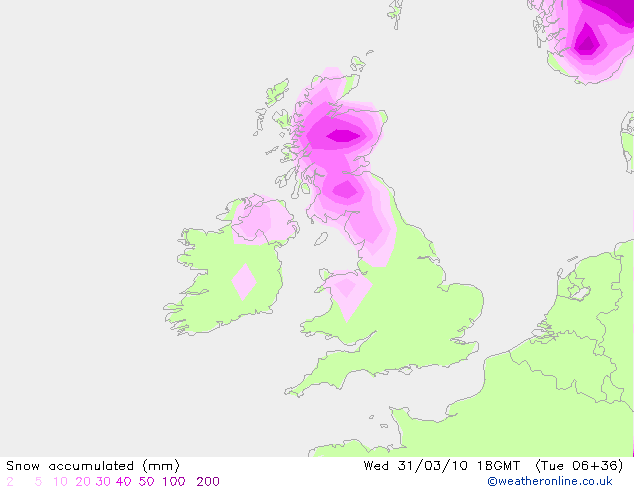
The UK Met Office (equivalent of the NWS in the US) is forecasting for 40 cm (about 16 inches) of snow or more in the Highlands of Scotland through Wednesday. The prediction of snow and gale-force winds prompted the UK Met Office to issue an early weather warning on Sunday, for heavy snow and blizzards over much of Scotland (and northern Ireland). That warning was updated today to an emergency weather warning for severe blizzards, severe drifting snow, and very heavy snowfall. Obviously, Edinburgh, sitting on the coast, won’t receive as much snow, but the city may still get a few inches that will get blown around in the winds.
Here’s the GFS model (from Weather Online UK) of 6-hr snow accumulation, ending after the heaviest snow through 18Z (7pm local time) on Wednesday. This map shows a max of 40 – 50 mm of snow over the Highlands from 12Z to 18Z Wednesday.
For more information on Edinburgh, here’s a link to Wikipedia.
For more information on the ongoing blizzard, here’s the BBC weather news page.
For weather maps and information on Edinburgh weather, including the latest weather warnings, see the UK Met Office or Weather Online UK (great collection of weather maps and models for all over the world).
Next Tuesday I’ll take a look at the climate and weather in another part of the globe. As always, if you have any comments or suggestions for future cities, please leave a comment!
Permalink
« Previous Page — « Previous entries « Previous Page · Next Page » Next entries » — Next Page »


