12.26.10
Posted in Weather News, Winter Weather at 12:58 pm by Rebekah
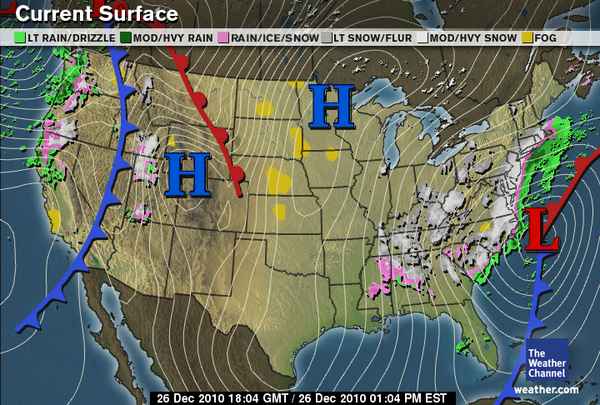
The East Coast is currently in the throes of a major snowstorm. Some parts of northern Alabama recorded their first White Christmas in recorded history yesterday (Atlanta had their first in over 100 years) and Philadelphia is expecting nearly a foot of snow within the next 48 hours (see The Weather Channel snow forecasts), leading the NFL to postpone the Vikings-Eagles game tonight.
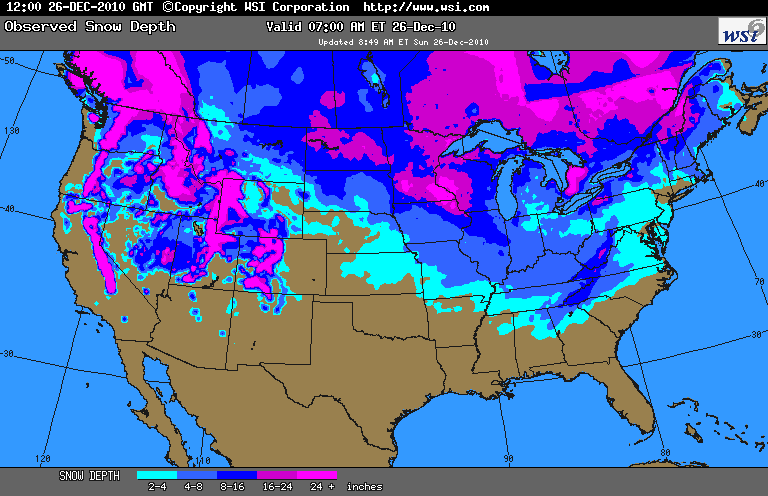
In the meantime, much of the rest of the U.S. had a White Christmas as well. According to a snow depth map from WSI (see below), the only states in the contiguous U.S. that did not have any recorded snow on the ground were Texas, Louisiana, and Florida.
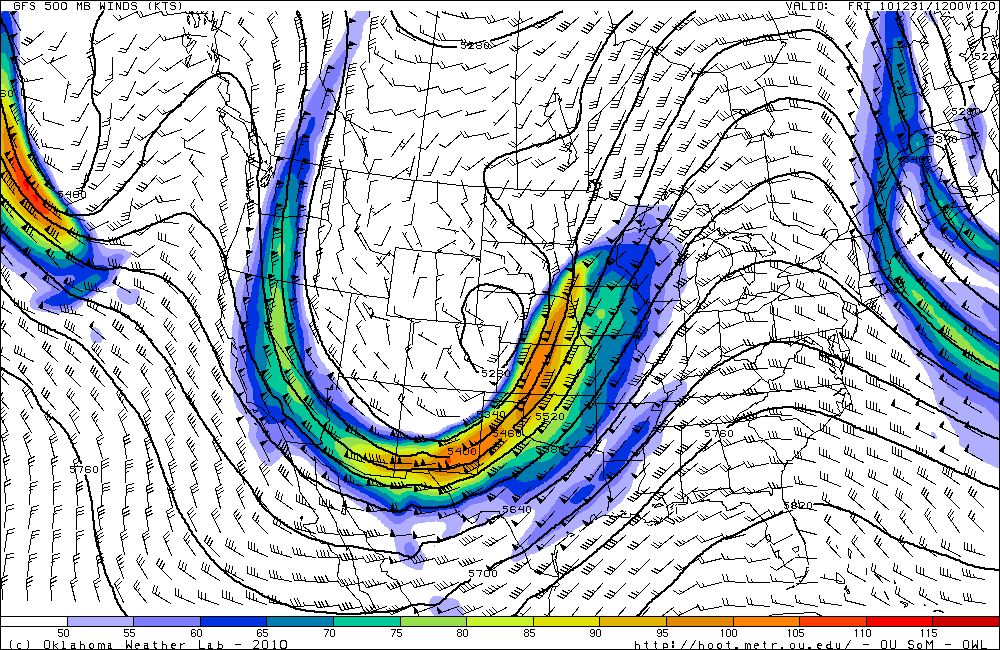
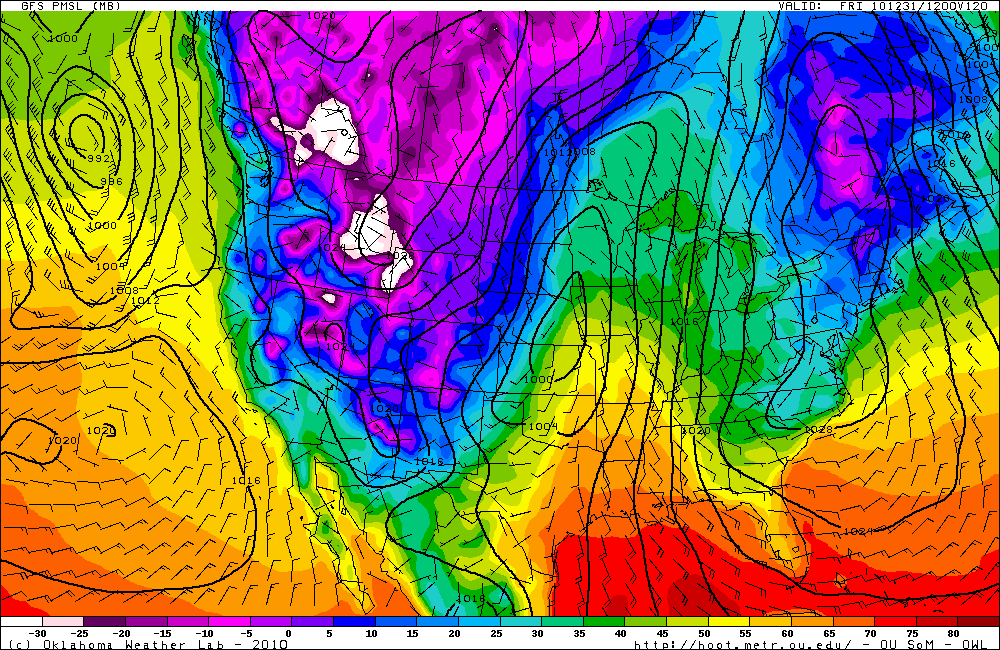
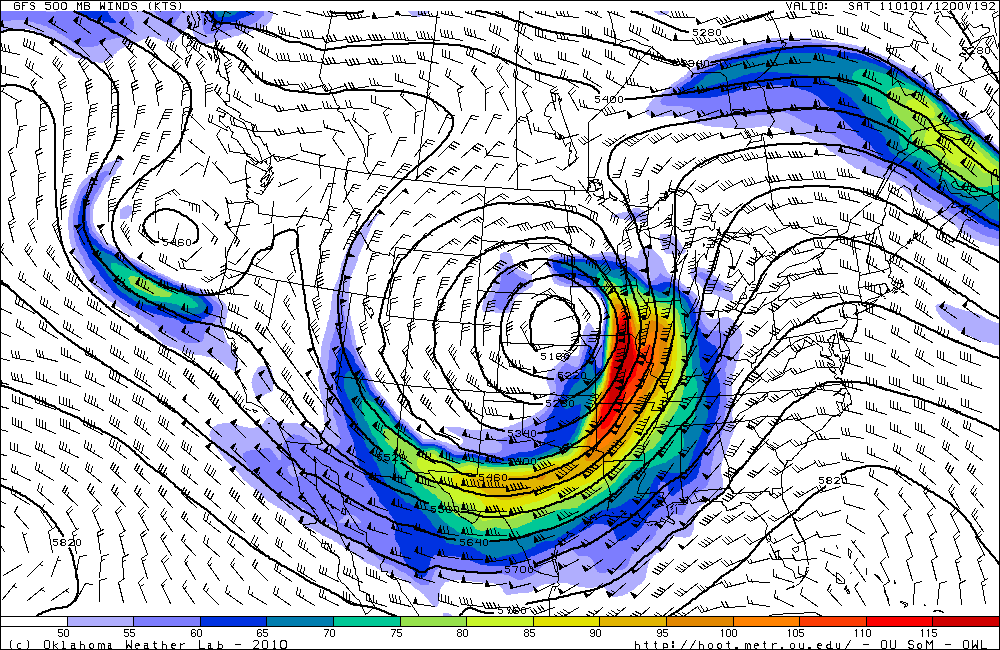
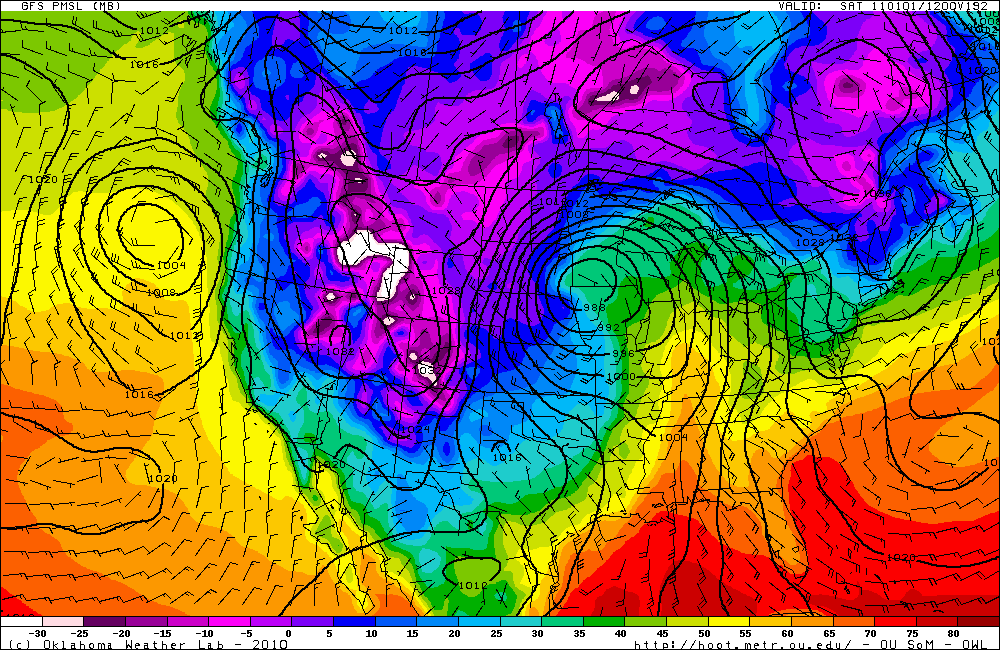
Looking ahead, the next major weather-maker remains a digging trough on New Year’s Eve into New Year’s Day. There is a possibility for some severe storms and winter storms with this system.
Upper-air (500mb) map from HOOT, forecast valid for 12Z December 31st (morning of New Year’s Eve):
Surface map for the same time:
Stay tuned!
Permalink
12.24.10
Posted in Weather News, Winter Weather at 6:56 pm by Rebekah
Back in Ellensburg for the week, and once again we’ll be enjoying a White Christmas tomorrow! There is nearly a foot of snow on the ground, and there is a chance for more to fall before tomorrow night. In fact, I don’t remember the last time I had a Christmas where there wasn’t at least some patches of snow on the ground.
Here’s The Weather Channel‘s forecast for the chances of a White Christmas across the U.S.:
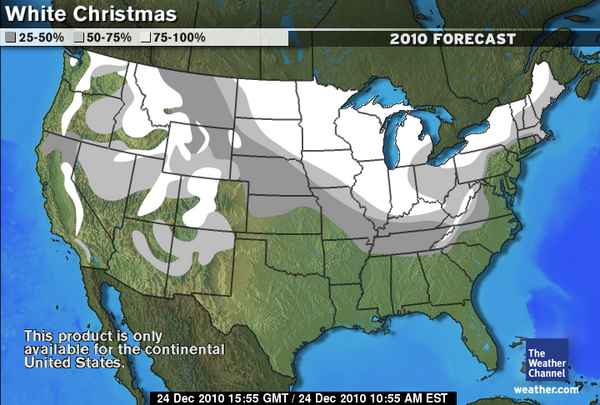
While the East Coast may not get much of a White Christmas this year, there is a chance for a decent winter storm from the Carolinas to New England on Sunday and Monday.
As to what other weather we may get in the near future, I leave you with these 500mb and surface model forecasts (from the GFS, from OU HOOT) for New Year’s Day morning:
Merry Christmas!
Permalink
12.11.10
Posted in Weather News, Winter Weather at 1:49 pm by Rebekah
Here’s the latest map of surface observations in the Midwest (click to enlarge), from UCAR.
For those of you who don’t know what you’re looking at, the big dots mark weather station locations, the lines going into the dots show wind direction (while the lines coming off those lines show wind speed), the red numbers are temperature, the green numbers are dewpoint, and the symbols show the weather type (e.g., snow in asterisks, rain in dots).
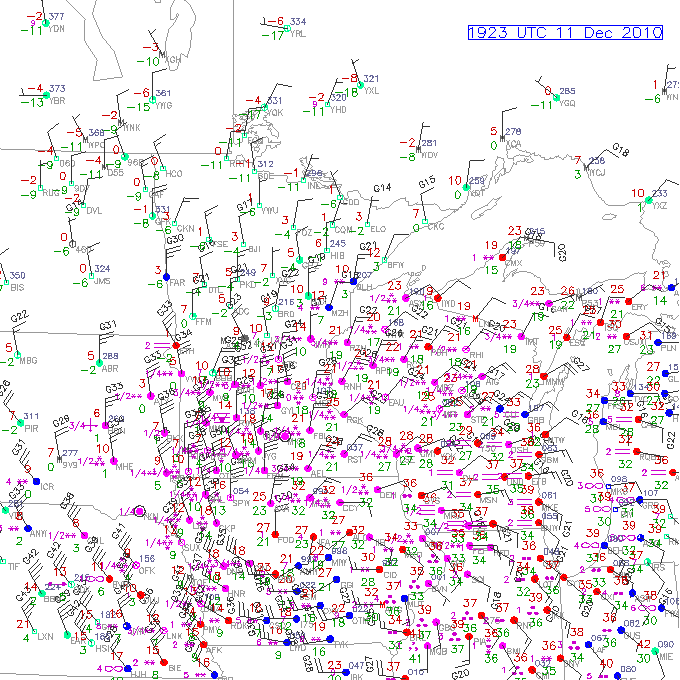
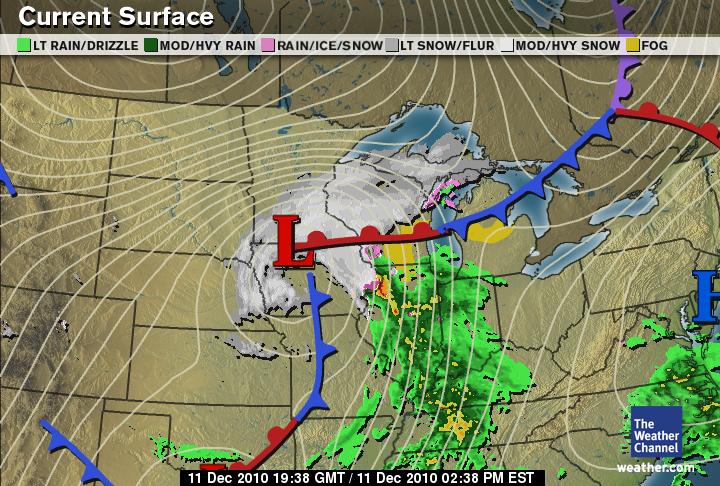
Note how the winds are swirling counter-clockwise around northern Iowa. This marks the location of the surface low. Note also how there is a lot of snow falling in northern Iowa and southern Minnesota!
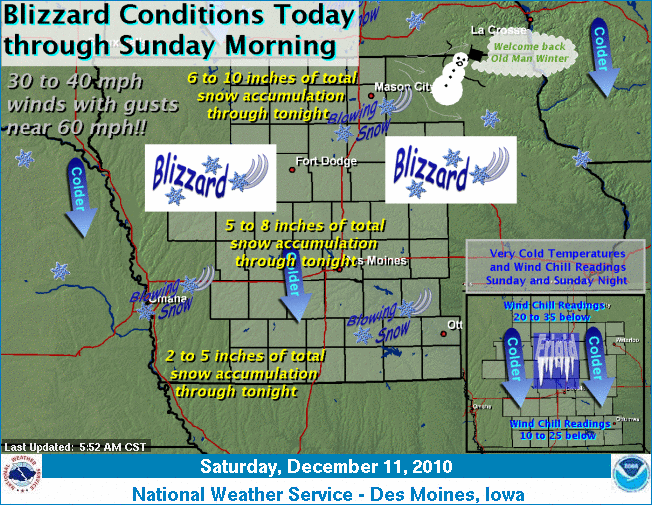
A blizzard is defined as blowing snow (doesn’t have to be falling) with winds of at least 35 mph and visibility of less than 1/4 mile for at least 3 hours. The strongest winds around a low-pressure system are typically on the northwest side, hence why the worst of this blizzard may actually be once the low has moved farther east.
Weather Channel surface map:
NWS Des Moines weather forecast:
Permalink
11.11.10
Posted in Winter Weather at 5:01 pm by Rebekah
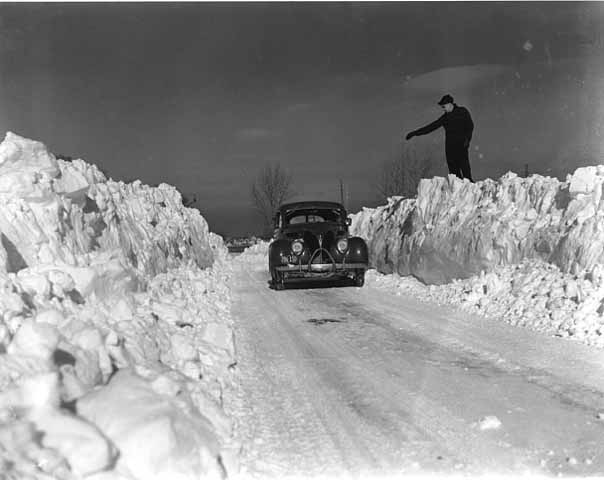
Armistice Day Blizzard, Minneapolis. From the Minnesota Historical Society. Click to enlarge.
70 years ago today, biting cold winds and blowing snow unexpectedly struck the Midwest. On November 11, 1940, the Armistice Day Blizzard brought snowfall totals of up to 27 inches, winds of 50 to 80 mph, 20-foot snow drifts, and temperature drops of up to 50 °F (30 °C) to parts of Minnesota, Wisconsin, Iowa, South Dakota, and Nebraska.
The day started off unseasonably warm, prompting many hunters to go out looking for ducks. However, the National Weather Bureau/Service did a poor job of forecasting a strong low-pressure system that would come up from the Texas/Oklahoma Panhandles.
The lowest recorded pressure in the center of the cyclone was 971 mb in Duluth, Minnesota. Between the strong pressure gradient and a strong temperature gradient, temperatures plummeted and a blizzard wreaked havoc and sadly caused around 150 people to lose their lives (many were on ships on Lake Michigan, while many others included the unprepared duck hunters).
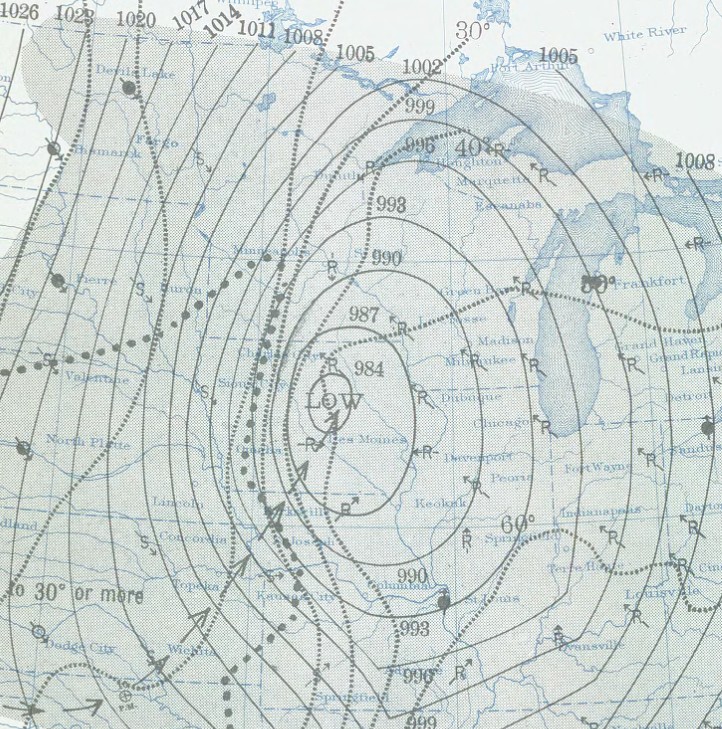
NOAA National Weather Bureau/Service surface map, showing the track of the cyclone, pressure, winds, and temperature lines. From Wikipedia. Click to enlarge.
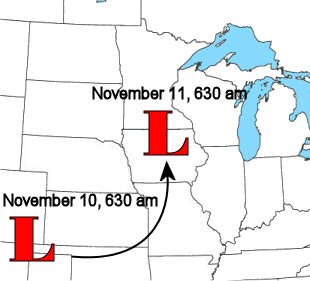
- Track of the low. From NWS La Crosse.
| Time |
Temperature |
| 430 am |
52 |
| 635 am |
49 |
| 735 am |
39 |
| 835 am |
30 |
| 935 am |
25 |
| 1035 am |
21 |
| 325 pm |
14 |
| La Crosse, WI temperatures (F) for November 11, 1940. |
(Table from NWS La Crosse.)
Following the blizzard, the National Weather Service expanded forecast duties to 24 hours and expanded the number of forecast offices.
For more information, see the NWS La Crosse, Wikipedia, the Minnesota Historical Society (photos), and The 1940 Armistice Day Blizzard (on the Alabama Weather blog).
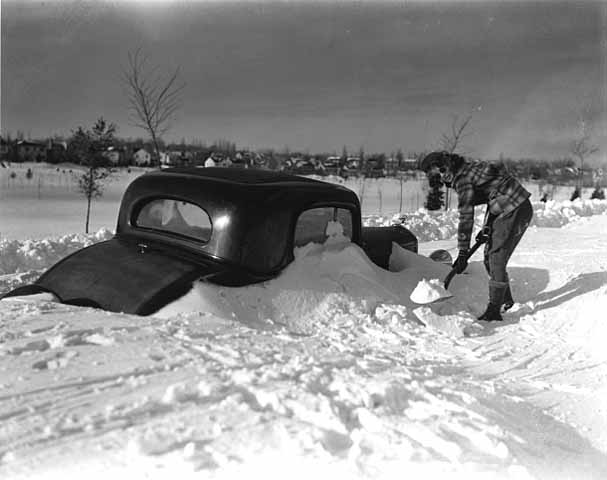
Armistice Day Blizzard, Minneapolis. From the Minnesota Historical Society. Click to enlarge.
Permalink
11.10.10
Posted in Weather News, Winter Weather at 6:51 pm by Rebekah
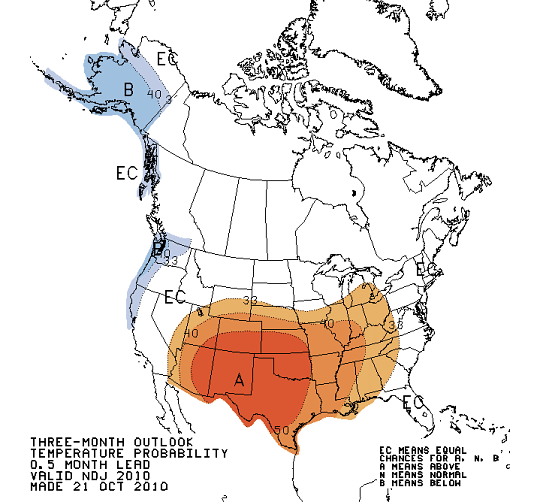
Here’s the Climate Prediction Center‘s outlook for November, December, and January, as of October 21. Keep in mind that the colors shown are probabilities of having above or below normal temperature or precipitation. A is above, B is below, and EC is equal chance.
Temperature:
Precipitation:
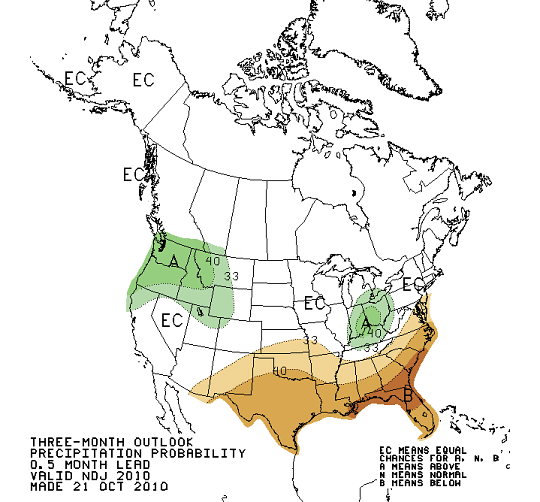
These maps are primarily based off of ENSO (El Niño / La Niña). We’re currently in a La Niña pattern, but there are other factors that play a role in what our climate may do in the next few months, so take these maps with a grain of salt!
Permalink
« Previous Page — « Previous entries « Previous Page · Next Page » Next entries » — Next Page »


