04.11.11
Posted in Weather Education at 8:00 am by Rebekah
Last week in the weather education series we went over how to decode surface maps; i.e., how to plot weather data and how to interpret data that has already been plotted. Now we’ll make more sense of all the weather data by contouring some of the data.
Contouring Weather Maps
Take a look at the surface map we used as an example last week.
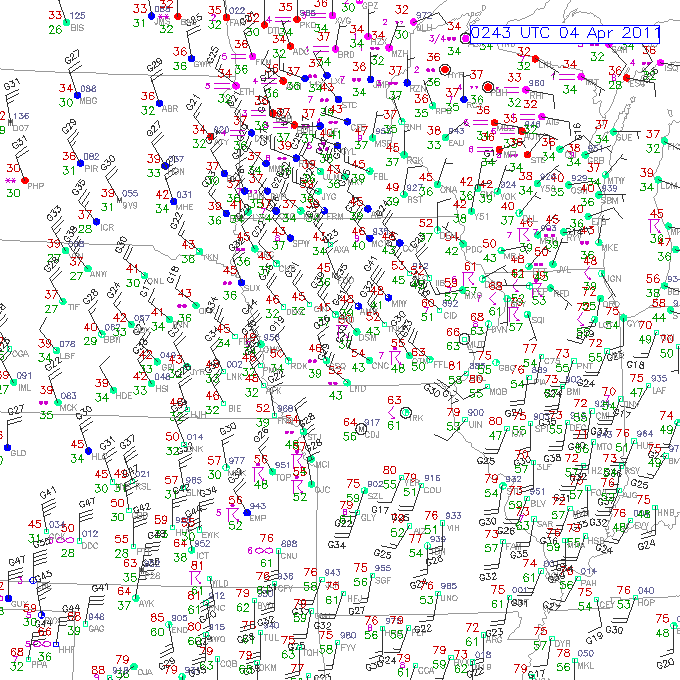
Even if we know how to read this map, we’ll be able to more quickly interpret what’s going on if we draw some contours and other symbols.
By drawing contours, I mean drawing isolines: lines of equal measurement.
For example, say we want to contour temperature every 5 degrees, starting with 60 °F. We will then look the temperature recorded at each station, and draw a line through where we expect to find a temperature of 60 °F. Areas above 60 °F will be on one side of the line, and areas below 60 °F will be on the other side of the line. Points with a temperature of exactly 60 °F will be on the line. The next step would be to draw a contour of 55 °F or 65 °F, until we have drawn lines every 5 degrees.
There are a few rules when it comes to drawing contours.
- Contours should never cross or touch (it surely can’t be both 60 °F and 70 °F at the same point!)
- Contours should be smooth; no corners (this isn’t dot-to-dot…contours should be a bit rounded)
- Do not draw in any more details than the data allow (you should not draw dramatic curves where there is no station data to support this…also, you should not draw a 60 °F circle inside a 65 °F circle unless there is a station inside the circle with a temperature of less than 60 °F)
- Contours should be closed or reach the edge of the map (do not start a line in the middle of the map or leave one hanging)
- Contours should be labeled (don’t forget to write 60 °F on or at the end of the 60 °F contour)


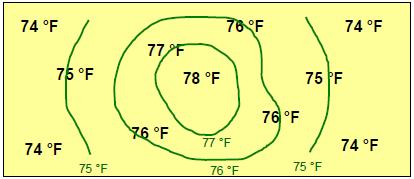
Here is a simplified example of drawing temperature contours every 1 degree:
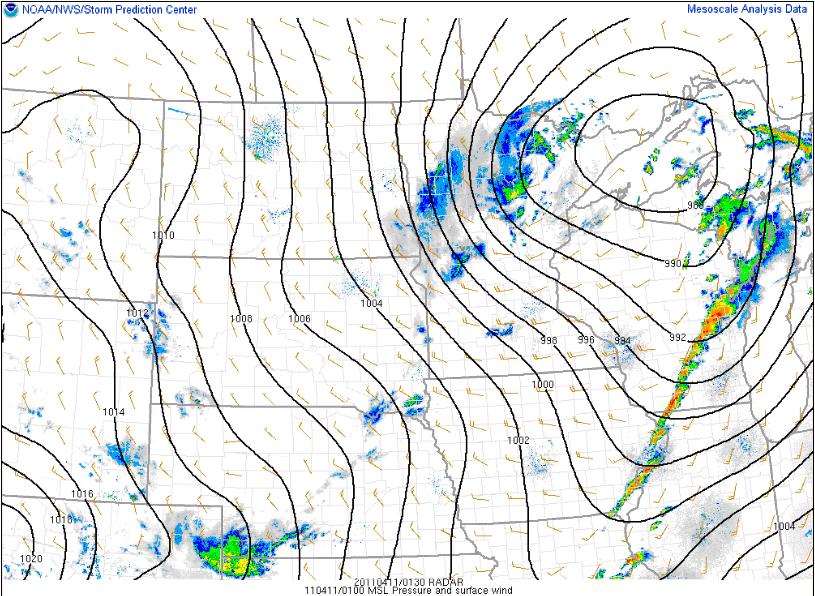
And here is an example of pressure contours every 2 millibars (along with wind barbs and radar reflectivity) from the Storm Prediction Center last night:
Types of Contours
Here are the names for a few common types of contours, or isolines (remember “iso” means “equal”)
- isotherms – lines of equal temperature
- isobars – lines of equal pressure (remember the basic pressure measurement is a bar, or millibar)
- isodrosotherms – lines of equal dewpoint temperature
- isotachs – lines of equal wind speed
- isoheights – lines of equal heights (we’ll get to what this means later, once we move to upper-air maps)
So, for example, the first simplified map showed isotherms, while the map of the Midwest and Northern Plains showed isobars. You will often see isobars plotted on surface maps.
Other Weather Symbols
You may also see the following front and dryline symbols commonly plotted on surface maps, as well as a large red “L” indicating a low pressure center and a large blue “H” indicating a high pressure center. We will talk about fronts and drylines later in the series.
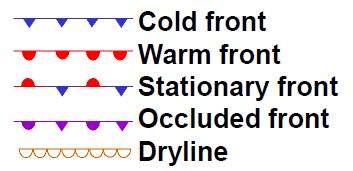
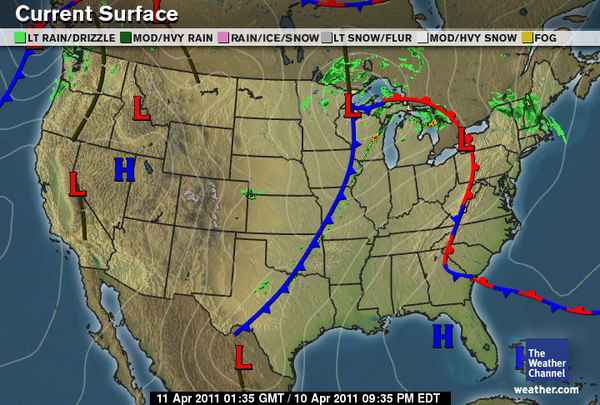
Here’s a map from The Weather Channel from last night, showing isobars, radar, lows and highs, and fronts (ignore the brown dashed lines for now…those are troughs).
————————————————–
Next Monday we will move on to upper-air maps!
Permalink
04.10.11
Posted in Severe Weather Post-analysis at 8:00 am by Rebekah
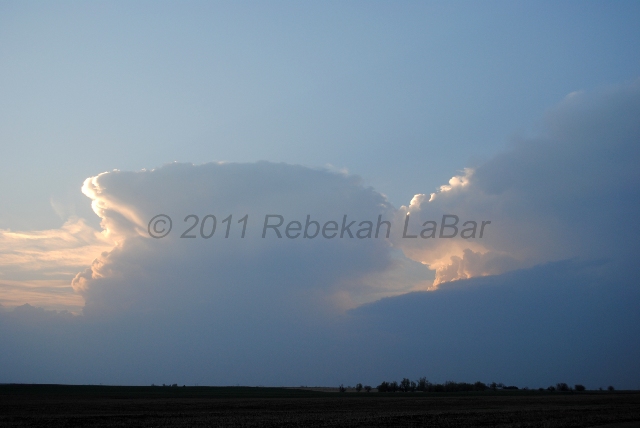
Storms in Kiowa County, Kansas, near sunset
I didn’t want to go all the way up to Iowa yesterday (check out the tornado reports), but there was a marginal chance for storms along the dryline from west central Kansas through northwest Oklahoma.
Jeff Makowski and I drove up to northwest Oklahoma early yesterday afternoon, and sat for a while in a large parking area at the intersection of US highways 281 and 412 (east of Woodward, north of Seiling, southwest of Alva).
We hung out there for some two and a half hours or more, watching cumulus along the dryline attempt to bubble up, only to get mixed out and dissipate. The surface dewpoints started in the low 60s, but mostly mixed out to the upper 50s by later in the day. It was also pretty windy, and a lot of dust got kicked up around us.
Close to 6 pm, we decided to go north on 281 up to Alva, to find some food and air conditioning. Almost no sooner did we start to go north than we saw a cumulus cloud start to grow outward as well as upward, corresponding with the first blip of the day (for the area) on radar.
We picked some gravel roads to drive on for a while, as shortcuts to the Kansas border, in an effort to intercept the growing storm. This little shower dissipated fairly quickly, but a few more tried to get going there as well. We saw a coyote run across the road somewhere around the border.
Another random note from about this time is we heard a radio station that was playing Alvin and the Chipmunks’ “Christmas Don’t Be Late”. Astonished to hear Christmas music on the radio in early April, we continued to listen long enough to hear the DJ come on and declare how he loved Christmas, and would start to play Christmas blues music (which he did, and then we changed the channel).
By the time we crossed over into Kansas, a couple of elevated thunderstorms had moved just north of Coldwater. The photo above was taken between Medicine Lodge and Pratt, as we were driving north on US Highway 281. The main storm is on the right side of the photo, with the southern storm in the middle. This photo did not do the scene justice, as the sun very nicely lit up this convection just before setting.
We started to see lightning about this time; we saw quite a bit of intracloud and anvil lightning, with a few cloud-to-ground strikes.
These two storms pretty much combined after this, and raced away to the northeast. When we arrived at Highway 50, near St. John, we headed east to go back to I35. As we drove along on 50, we saw quite a bit more lightning as it started to get dark. The storm didn’t last too much longer after sunset, though.
All in all, the day went about as expected, although I didn’t expect to end up so far north in Kansas (I didn’t think I’d go north of Wichita, or even Wellington)! Despite traveling farther than I’d hoped, it was still a good day in that we saw a couple of decent thunderstorms (the main one may have briefly been a supercell, but we never confirmed if it was rotating or not) and some more mammatus and lightning.
I won’t be chasing today, as the southern target is too far east for me, but I am looking forward to the next chase opportunity for the Southern Plains, which hopefully could be sometime later this week!
Permalink
04.09.11
Posted in Severe Weather Forecast at 12:18 pm by Rebekah
There’s a marginal chance for supercells again today in western Oklahoma, along a dryline. I don’t have much time to write up a forecast now, as we’re off in a bit to Alva, Oklahoma area.
I’ll update from the road as the occasion arises.
I tried to stream some live video yesterday, but am having problems with my streaming camcorder at present. Sometimes the connection to my laptop just gets dropped, and I have to set it up again. It doesn’t take long to do that, but it means I don’t always have a continuous stream. If we see something interesting today, I will do my best to stream it as well as I can…keeping in mind that data coverage isn’t as good in northwest Oklahoma!
Permalink
Posted in Severe Weather Post-analysis at 8:00 am by Rebekah
Yesterday I went chasing in north central Oklahoma, and got on a cell just as it began to form, south of Enid. We followed this developing supercell for a little while, before heading off to chase the more beautiful-looking storm to our northeast, in Kay County. We figured it may have been closer to a boundary that might allow for better rotation and a more sustainable updraft.
To make a long story short, we got closer to the Kay County storm before calling it off to head south, as our first storm had begun to show signs of tightening rotation. This could have been a mistake, but the northern storm wasn’t looking any better, and both storms looked pretty ugly on radar.
Shortly after making the decision to go south and meet up with the approaching southern storm, the northern storm was tornado-warned. Of course! Someone reported a tornado up there, but it was too late for us. A funnel cloud had been reported anyway with the southern storm.
The southern storm was starting to cross I-35, and with the bad road networks east of the freeway, we decided to try to keep well out ahead of the storm, which cost us the chance to see any of the large hail that some chasers witnessed, or any rotating wall clouds from up close.
There are a few things we could have done differently, but it was a tough day in terms of first deciding a target area, and then deciding a storm, and then deciding the best roads in not-very-good chase territory (east of I-35, anyway).
I still had fun, though, and remind myself it’s early season. We saw two supercells (updraft bases but missed the wall clouds, boo), beautiful convection (I’d been missing that!), lots of mammatus, lightning (cloud-to-ground, anvil, and other intracloud lightning) and thunder, and some much needed rain. We didn’t even have to leave the state!
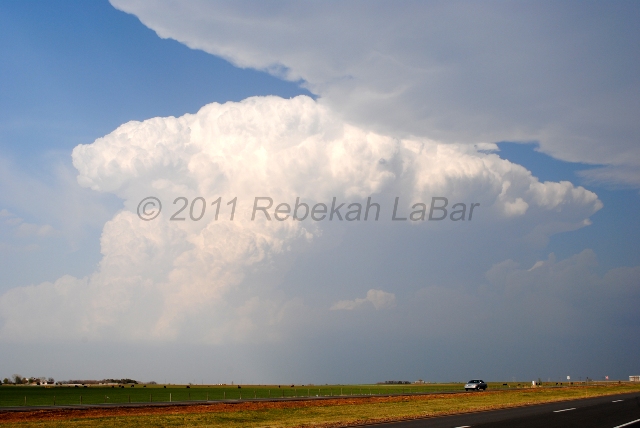
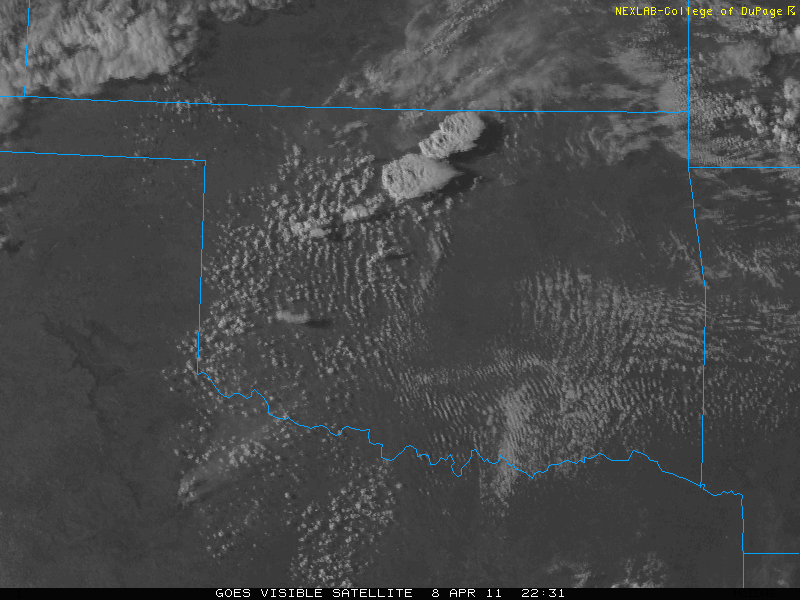
I didn’t take a lot of photos this day, but here’s one of the Kay County (northern storm) as it was going off (you can see the edge of the southern storm’s anvil at the top), followed by a visible satellite image showing the two storms at this time:
Permalink
04.08.11
Posted in Uncategorized at 3:13 pm by Rebekah
Well, I decided to chase today after all. I had my eye on tomorrow more, but in the end couldn’t resist the opportunity to go for an in-state chase.
Currently we’re just northeast of Enid, and headed for Enid and possibly points south of there. There is already a decent cumulus field forming in southwest Oklahoma, but I’m still tempted by the northern Oklahoma target.
A stationary front near the Kansas / Oklahoma border could provide a greater chance for lift and low-level shear for supercells, but of course the instability is higher and cap is more likely to break in southwest Oklahoma.
Permalink
« Previous Page — « Previous entries « Previous Page · Next Page » Next entries » — Next Page »


