03.04.11
Posted in Weather News at 8:00 am by Rebekah
The Iditarod starts tomorrow, the nearly 1,150-mile trek across southern Alaska for sled dogs and mushers. I’ll be posting occasional info about the race and the weather in Alaska over the next week. To begin with, here’s a map of the race and the National Weather Service forecast for this weekend’s weather in Anchorage, where the race starts at 10 am local time tomorrow.

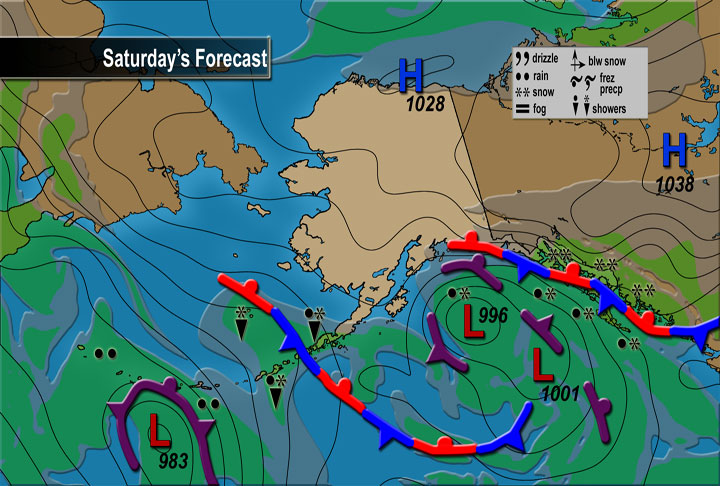
National Weather Service Anchorage forecast:
Saturday…Partly cloudy. Highs in the lower to mid 20s. Light winds.
Saturday Night…Partly cloudy. Lows 5 to 15 above except 5 below to 5 above east anchorage. Light winds.
Sunday…Mostly sunny. Highs in the 20s.
Permalink
03.03.11
Posted in Weather - Miscellaneous at 8:00 am by Rebekah

This beautiful image was taken recently by a NASA MODIS satellite (click to enlarge).
Anyone want to venture a guess as to what we’re looking at (location and/or feature)?
I’ll post the answer in the comments after 8pm Central Time.
Permalink
03.02.11
Posted in Uncategorized at 8:00 am by Rebekah
Yesterday marked the beginning of meteorological spring. This is also about the time when climatologically, tornado season begins to pick up.
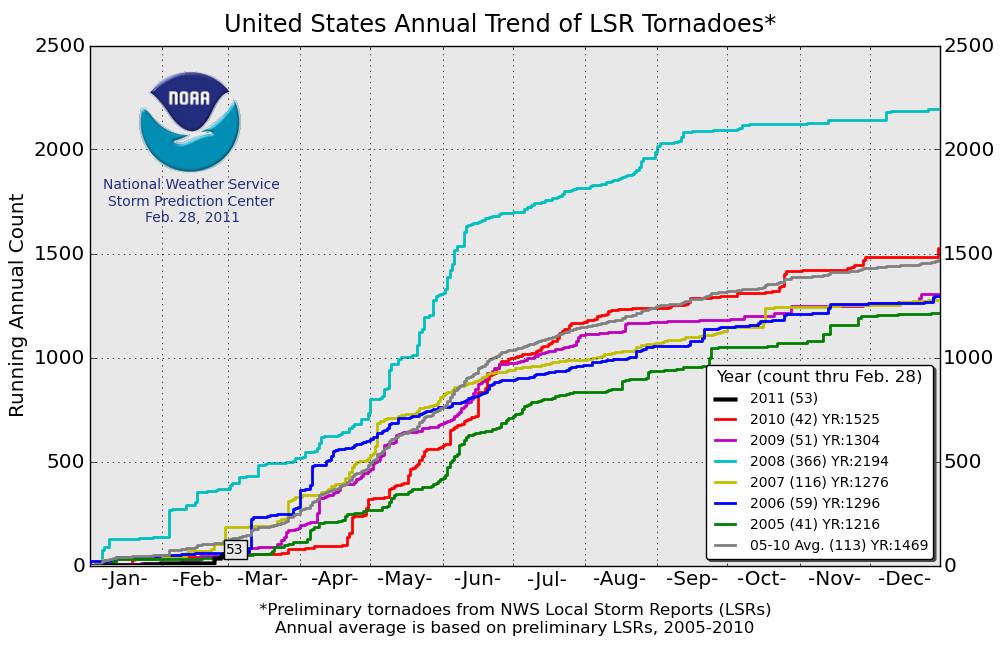
Here are a couple of plots from the Storm Prediction Center, showing where we are so far this year on tornadoes.
Through the first couple months of the year, there have been 53 tornado reports, which is below the 6-year running average.
The following graph shows the trend in local storm reports (LSR) of tornadoes in the U.S. Values may be a little higher than the actual tornado count (some tornadoes may have been reported more than once). The last six years are shown, as well as the current year up through February 28.
Now look at the graph below (click to enlarge), also from the Storm Prediction Center. This plot shows annual tornado trends; if you’re curious as to how exactly the trends were calculated, see the website on the bottom of the figure. Basically, the red line is the maximum tornado count in a single year and the pink line is the minimum tornado count in a single year. The other lines show tornado trends in quartiles. Currently, 2011 is just above the lowest 25th percentile.
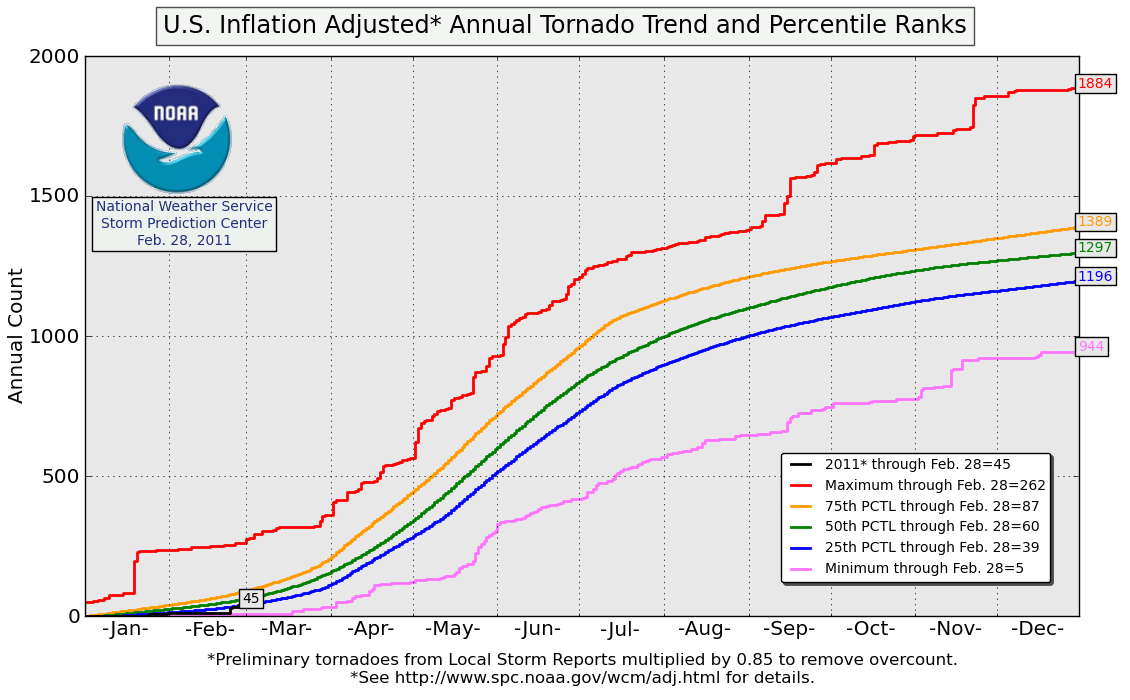
Note the estimated number of tornadoes for 2011 so far is 43 (adjusted downward from the storm reports), though this value is not necessarily the same as the confirmed number of tornadoes.
Permalink
03.01.11
Posted in Non-US Weather, Weather News at 8:00 am by Rebekah
This week’s post in the global weather and climate series features Tripoli, Libya.
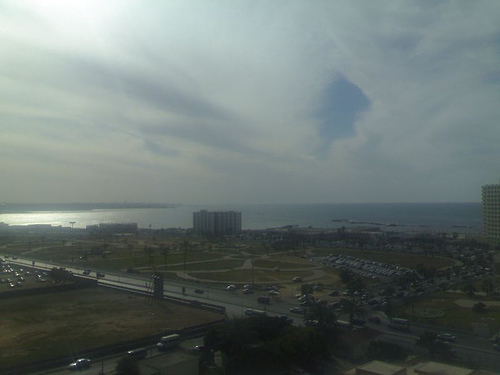
Looking over Tripoli to the Mediterranean. From Wikipedia
Tripoli is situated in the northwest part of Libya, on the Mediterranean Coast and the edge of the desert. Founded by the Phoenicians in the 7th century BC, Tripoli has had a long and rich history, between at least the Phoenicians, Greeks, Romans, Spanish, Turks, and Italians.
Today, the Tripoli metro area is home to 1,065,405 people (as of 2006). The capital of and largest city in Libya, Tripoli has been ground zero for the protests and revolts against the government and the leader of the country, Gadhafi. Tripoli is also the largest commercial and manufacturing center in Libya.
A few more facts about Tripoli (from Wikipedia):
- Time zone: Eastern European Time (UTC+2)
- Average elevation: 266 ft (81 m)
- Climate zone: Mediterranean
- Average high temperature: 78 °F (25 °C)
- Average low temperature: 60 °F (16 °C)
- Average annual high/low temperature range: 64 to 91 °F (18 to 33 °C) / 48 to 73 °F (9 to 23 °C)
- Average annual precipitation: 13 inches (334 mm)
Weather: Tripoli’s climate is Mediterranean, meaning it has warm, dry summers and cool winters with modest rainfall. This week Tripoli’s highs are in the low to mid-60s with lows in the mid- to upper 40s.
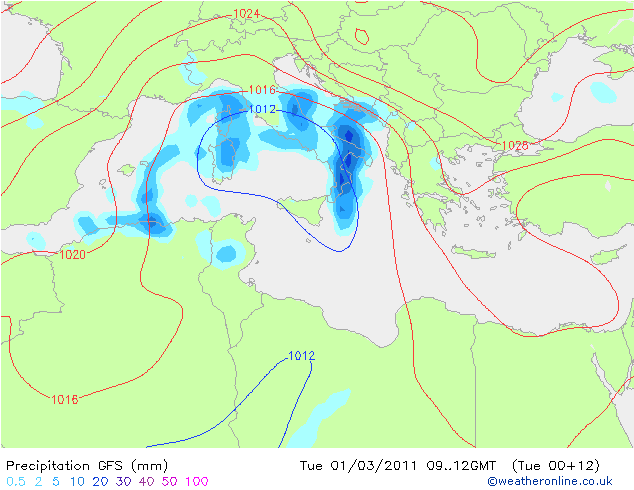
GFS forecast map for 1200 UTC today, showing low surface pressure over Italy, north of Libya (the filled contours indicate 3-hour precipitation). From Weather Online UK
For weather maps and information on current and forecast Tripoli weather, see Weather Underground and Weather Online UK (maps and models).
For more information on Tripoli, here’s a link to Wikipedia.
Next Tuesday I plan to take a look at the climate and weather in another part of the globe. As always, if you have any suggestions for future cities, please leave a comment!
Permalink
02.28.11
Posted in Weather Education at 4:00 pm by Rebekah
Meteorologists use two main methods to forecast the weather: analysis of weather data and analysis of weather models. In order to know the state of the atmosphere as accurately as possible, and in order to have the best data to feed into the weather models, we must first take good weather measurements.
A discussion of weather measurements can be broken up into three categories: surface observations, upper-air observations, and remote sensing (e.g., radar and satellite). Today we will touch on surface observations.
Surface Observations
Most surface observations are taken hourly around the world, and include measurements of temperature, dewpoint, pressure, wind speed and direction, cloud cover, precipitation, and current weather (e.g., thunderstorms or fog).
Temperature
Temperature is measured with a thermometer, though not all thermometers today have to be mercury-filled. Temperature can also be measured with an electrical resistor called a thermistor (this is what may be used in your thermostat to help regulate your heater or air conditioner).
Temperature units are given in Fahrenheit (°F), Celsius (°C), or Kelvin (K).
Dewpoint
Dewpoint temperature can not be measured directly, but is calculated from measurements of either the wet-bulb temperature or the relative humidity. Instruments include psychrometers and hygrometers. A psychrometer has two thermometers, one of which has the tip covered by a wet piece of cloth. As the moisture on the cloth evaporates, the temperature on the “wet-bulb” thermometer drops (remember evaporation takes heat, leaving the environment cooler). The drier the air, the more the water evaporates, and the lower the wet-bulb (and dewpoint) temperature.
There are many different types of hygrometers, including electrical ones and ones made of hair. You know how your hair can get frizzy or limp depending on the air’s humidity? Hair hygrometers take advantage of this property, and make humidity measurements based on it.
Dewpoint units are also given in Fahrenheit (°F), Celsius (°C), or Kelvin (K).
Pressure
Pressure was traditionally measured in a mercury barometer. An empty glass tube, closed on the top, would be placed in an open container of mercury, forming a vacuum inside the tube. The higher the pressure, the more the air would push down on the mercury, forcing some of it up the tube.
Today, pressure units are still often given in inches of mercury (in. Hg), though we typically use other types of barometers. Meteorologists report pressure in units of millibars (mb) or hectoPascals (hPa).
Wind
Wind speed is measured with an anemometer. A cup anemometer has three small cups on a horizontal plane, and the faster the wind, the faster the cups spin around. A newer way of measuring both wind speed and direction is with a sonic anemometer. Sonic anemometers just look like a few sticks sticking up, and use sound waves to detect the direction and speed of the wind.
Wind speed units are commonly given in miles per hour (mph), nautical miles per hour (knots), kilometers per hour (km/h), or meters per second (m/s).
Clouds
The amount of cloud cover and the height of the clouds can be measured with a ceilometer. A ceilometer sends up a laser beam which reflects off of clouds. Another way to assess the clouds is to just look out the window. 🙂
Precipitation
Rainfall can be measured with different types of rain gauges. One of my favorite types is the tipping bucket rain gauge, which consists of two small buckets on a seesaw device. When one of the buckets is full, it tips over and empties itself while the other bucket fills up.
Measuring snowfall can be a bit trickier; sometimes snowfall measurements are recorded by someone with a ruler, but there are automated ways of measuring the snow. It’s also important to measure the liquid water equivalent of snow, which is the amount of liquid water if the snow is melted. Even a heavy snow can result in a low liquid water equivalent. A standard snow to water ratio is 10:1 (i.e., 10 inches of snow to 1 inch of water), though a dry snow could be 20:1 or even 40:1 and a very wet snow could be 5:1.
————————————————–
Next Monday we will talk about upper-air observations, including weather balloons.
Permalink
« Previous Page — « Previous entries « Previous Page · Next Page » Next entries » — Next Page »


