02.01.11
Posted in Non-US Weather, Tropical Weather at 1:27 pm by Rebekah
Severe Tropical Cyclone Yasi is a Category 5 tropical cyclone this morning (Australian scale …Category 4 on the Saffir-Simpson scale).
The maximum sustained winds are 138 mph (221 kph), and the minimum central pressure is 924 mb. Yasi is moving towards the west-southwest at about 17 mph (28 kph).
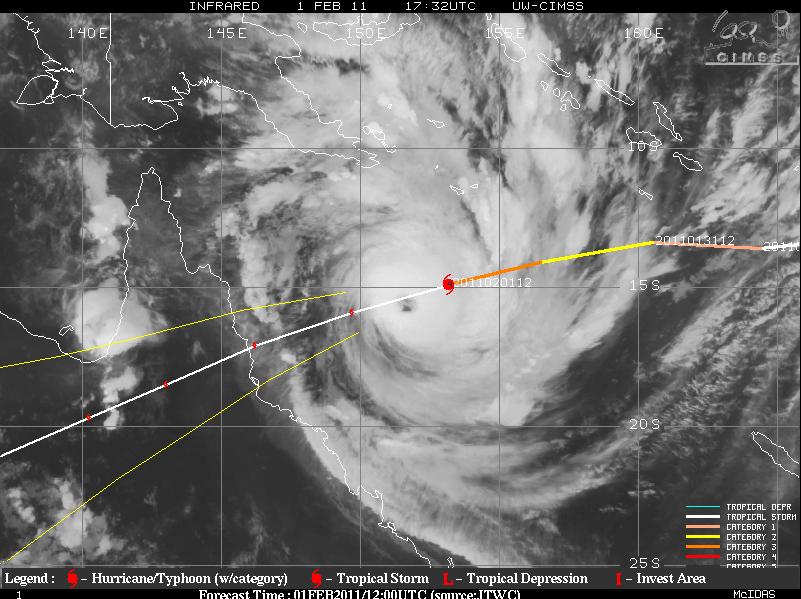
Yasi, at 1732 Z (3:32 am Australian EST), from UW-CIMSS (click to enlarge)
Yasi’s wind field is enormous, so don’t just focus on where the eye is headed…here’s some excerpts from the latest (5:01 am Australian EST) tropical cyclone advice from the Bureau of Meteorology:
“SEVERE TC YASI IS A LARGE AND VERY POWERFUL TROPICAL CYCLONE AND POSES AN EXTREMELY SERIOUS THREAT TO LIFE AND PROPERTY WITHIN THE WARNING AREA, ESPECIALLY BETWEEN PORT DOUGLAS AND TOWNSVILLE.”
“THIS IMPACT IS LIKELY TO BE MORE LIFE THREATENING THAN ANY EXPERIENCED DURING RECENT GENERATIONS.”
This is obviously some pretty strong wording, so if you are in the path of this cyclone, please take all warnings seriously, and find higher ground if you live near the sea. The storm surge is expected to be very high and some areas could get as much as 3 feet of rain, so there will be some flooding up and down the coast (and further inland, wherever the heaviest rains set up).
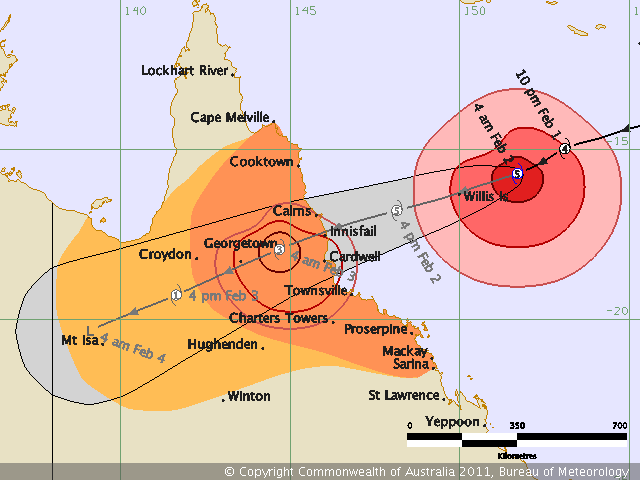
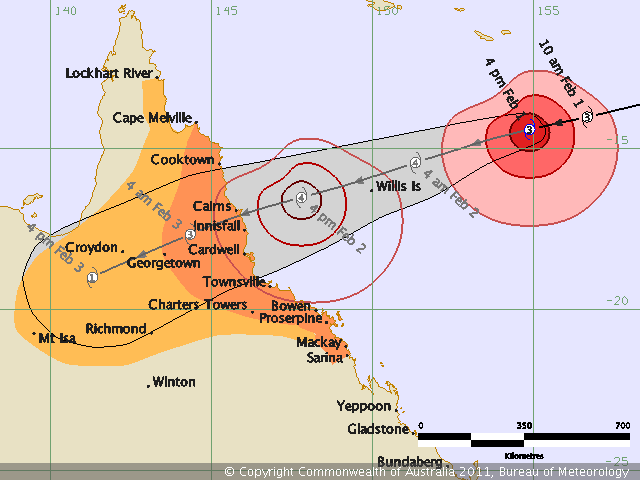
Yasi’s latest forecast track and intensity, from the Bureau of Meteorology (click to enlarge)
Permalink
Posted in Non-US Weather, Tropical Weather, Weather News at 8:00 am by Rebekah
This week’s post in the global weather and climate series features Cairns, Queensland, Australia.
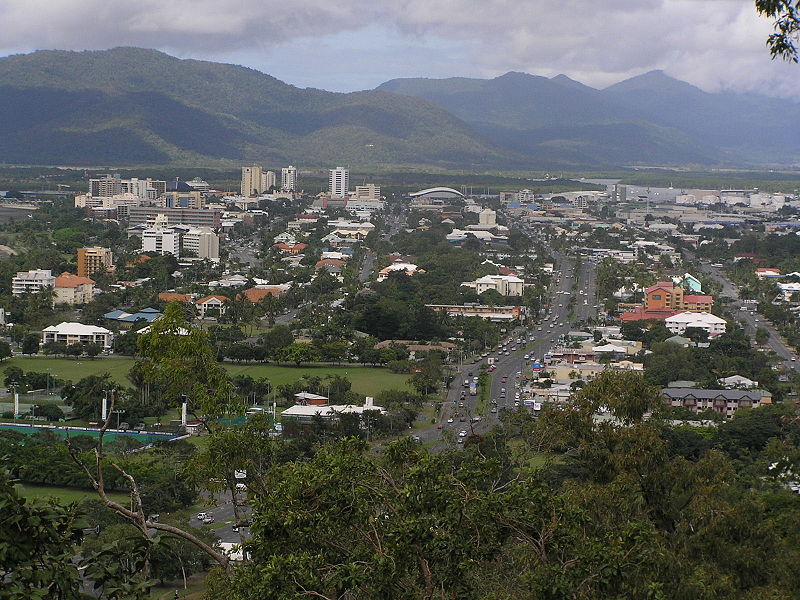
Cairns, from Mt. Whitfield, looking east. From Wikipedia
Cairns is situated on the northeastern coast of Queensland, on the eastern side of the Cape York Peninsula. The Great Dividing Range is to the west, and the Great Barrier Reef is just off the coast. Cairns is home to over 164,000 people.
Cairns was founded in 1876, and was later used by the Allied Forces during World War II as a base for Pacific operations. Today, the city is an important international tourism destination. Following Sydney, Melbourne, and Brisbane, Cairns is the fourth-most popular destination in Australia for foreign tourists.
A few more facts about Cairns (from Wikipedia):
- Time zone: Australian Eastern Standard Time (UTC+10)
- Average elevation: sea level
- Climate zone: Tropical monsoon
- Average high temperature: 84 °F (29 °C)
- Average low temperature: 69 °F (21 °C)
- Average annual high/low temperature range: 78 to 89 °F (26 to 31 °C) / 63 to 75 °F (17 to 24 °C)
- Average annual precipitation: 79 inches (2,011 mm)
Weather: February is climatologically the wettest month of the year for Cairns. The city’s monsoon climate means that there is a very pronounced wet season in the summer, with a dry season in the winter.
While not as affected by the Australian flooding as some points further south, Cairns has received copious precipitation recently. The rain is not going to stop any time soon, unfortunately; there is a chance of showers and thunderstorms every day and night for the next week or so, and Tropical Cyclone Yasi could bring as much as a foot or more of rain for some places around and just east of Cairns.
Models show Yasi could stall a bit in the mountains for about 12 hours or so after making landfall, bringing greater chances for large rain totals. Cairns will also get some strong winds (maximum winds could reach 100 mph, with higher gusts) from Yasi, as the cyclone is expected to make landfall as a Category 4.
See also yesterday’s post, Strengthening Tropical Cyclone Yasi.
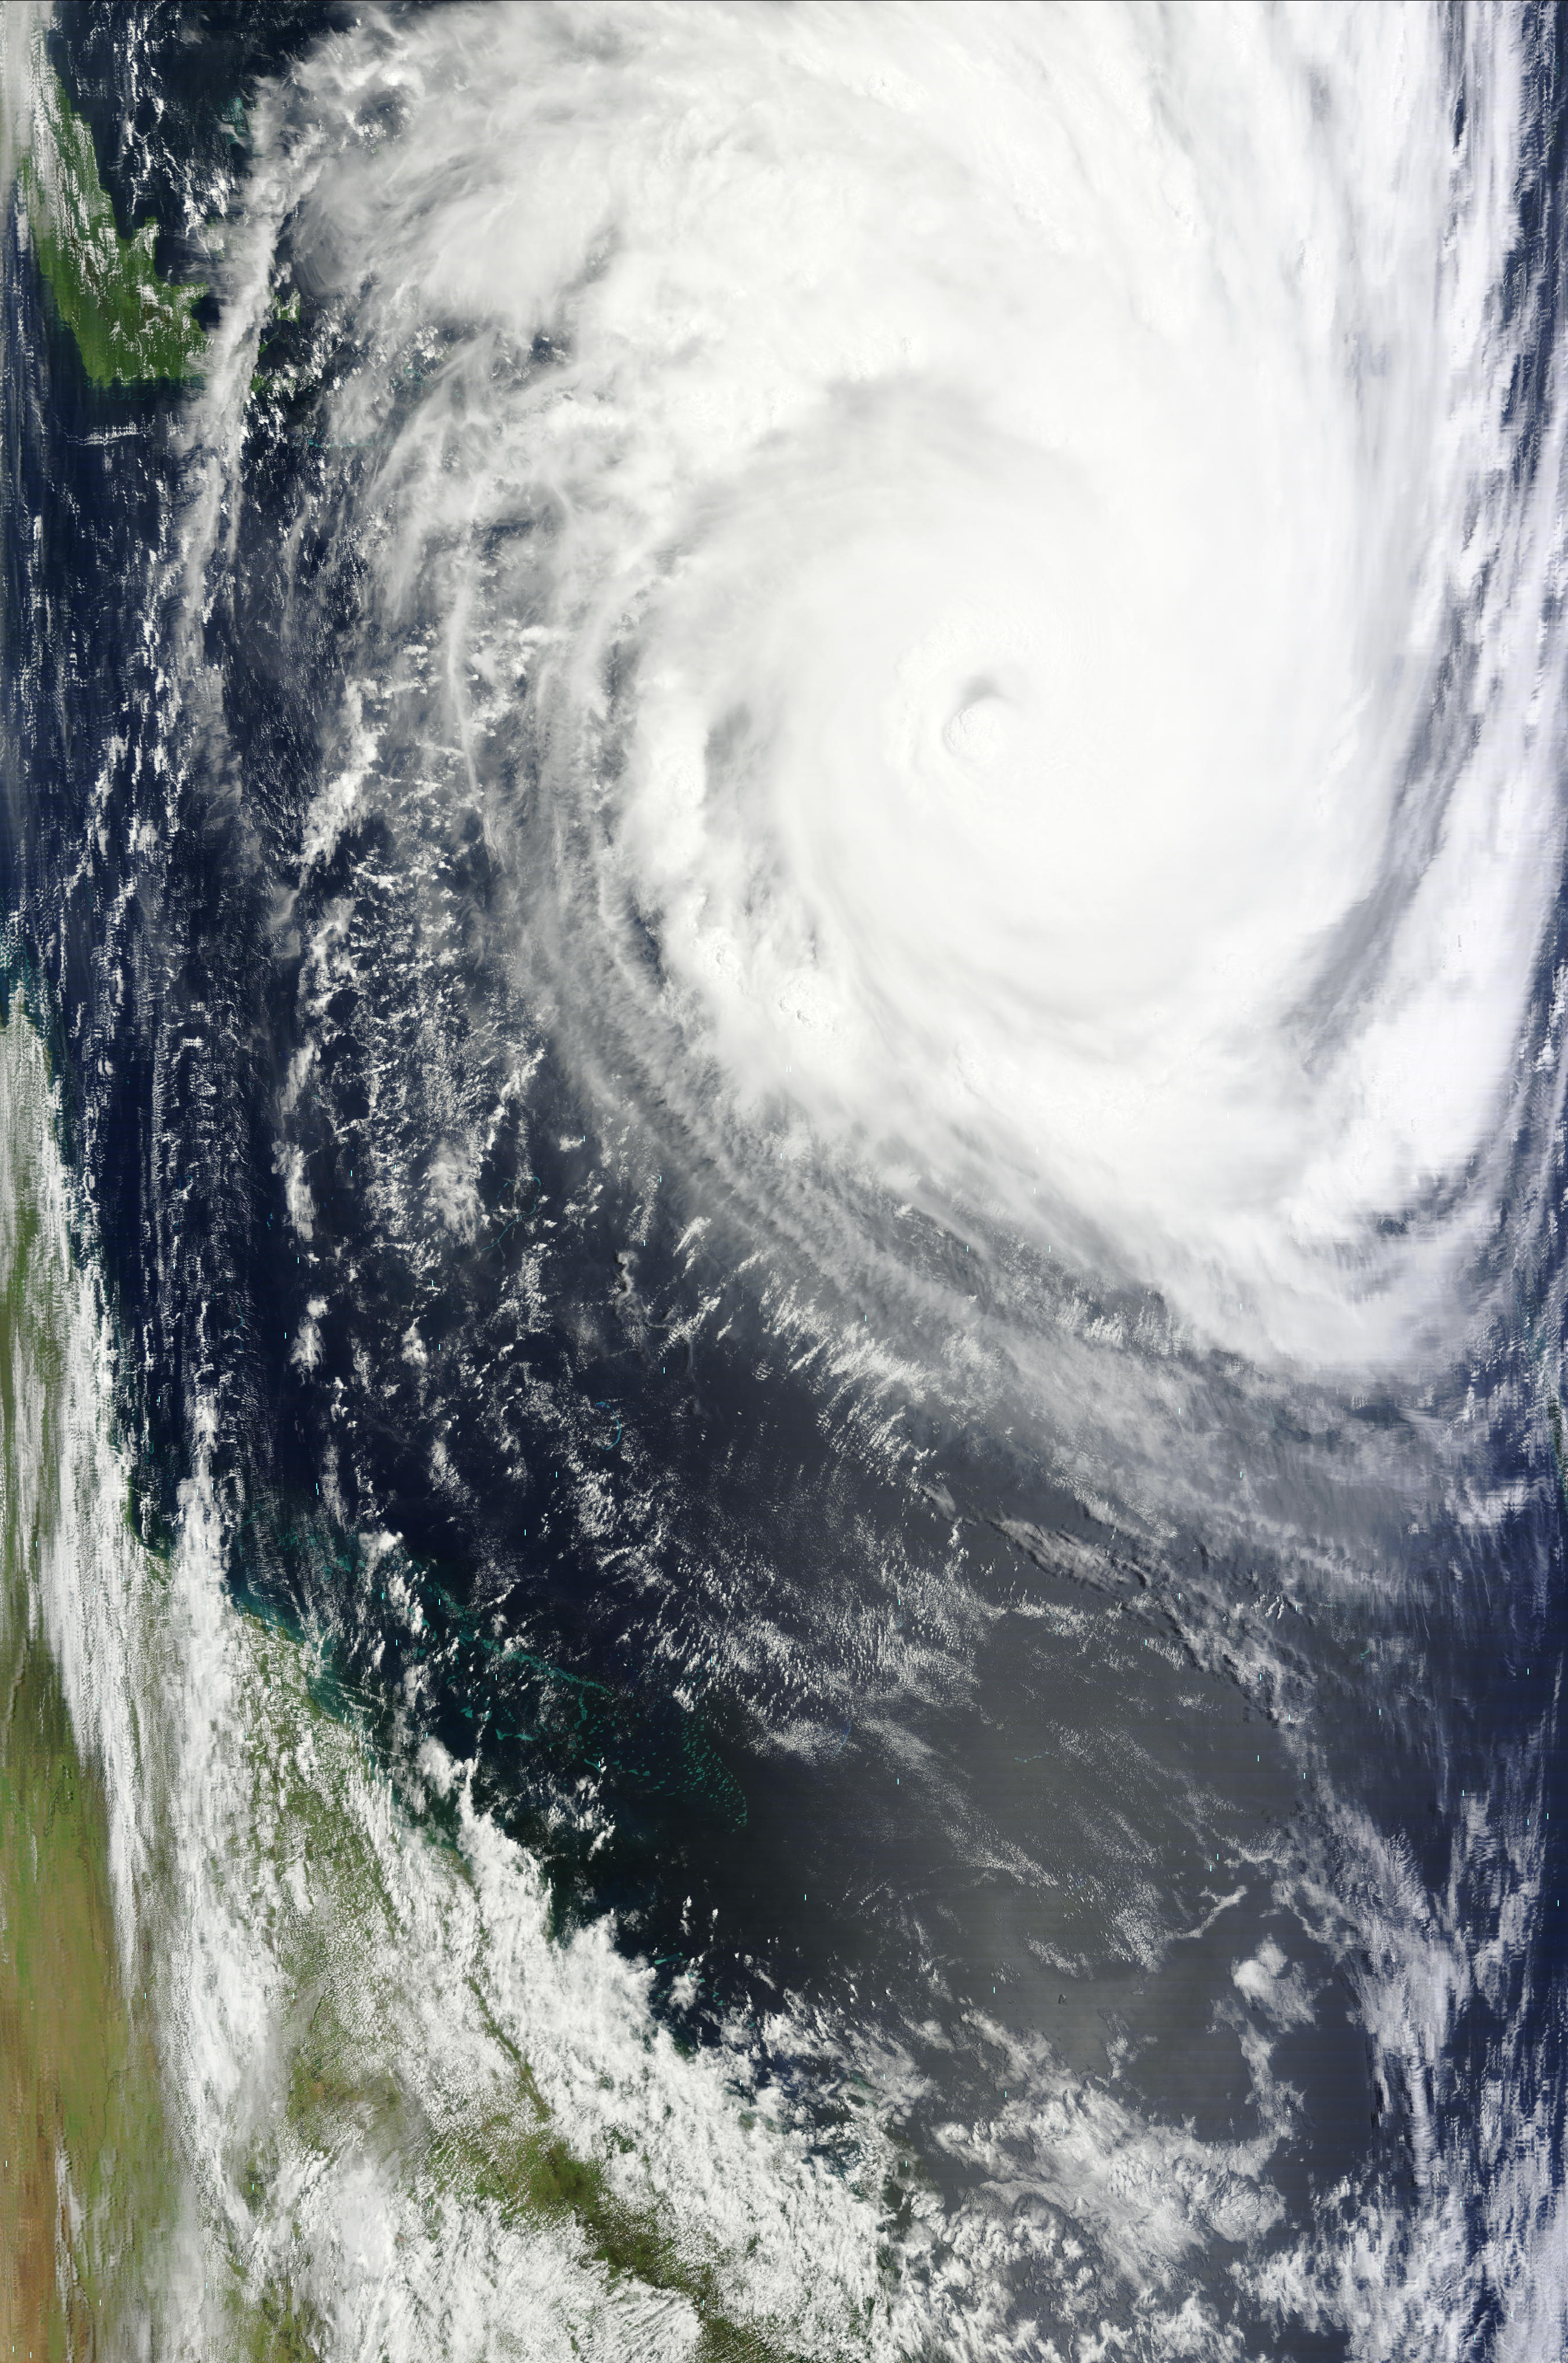
Tropical Cyclone Yasi, at 00Z (10am on the 1st, Australian Eastern Standard Time), from MODIS (click to enlarge)
For the latest on Tropical Cyclone Yasi, see the Australian Bureau of Meteorology.
For weather maps and information on current and forecast Cairns weather, see the Australian Bureau of Meteorology, Weatherzone, Weather Underground, and Weather Online UK.
For more information on Cairns, here’s a link to Wikipedia.
Next Tuesday I plan to take a look at the climate and weather in another part of the globe. As always, if you have any suggestions for future cities, please leave a comment!
Permalink
01.31.11
Posted in Weather Forecast, Weather News, Winter Weather at 3:47 pm by Rebekah
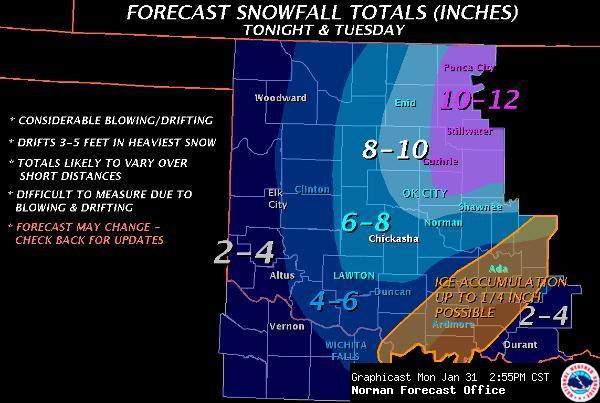
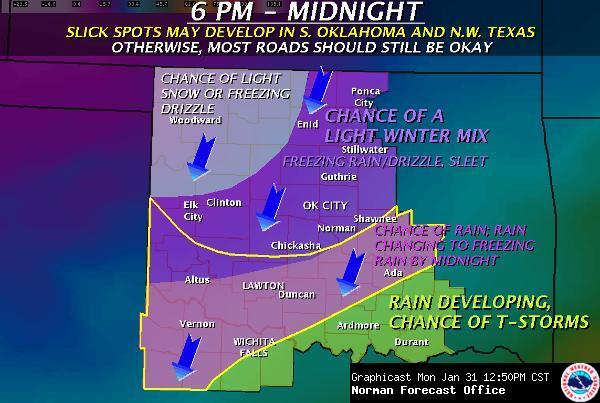
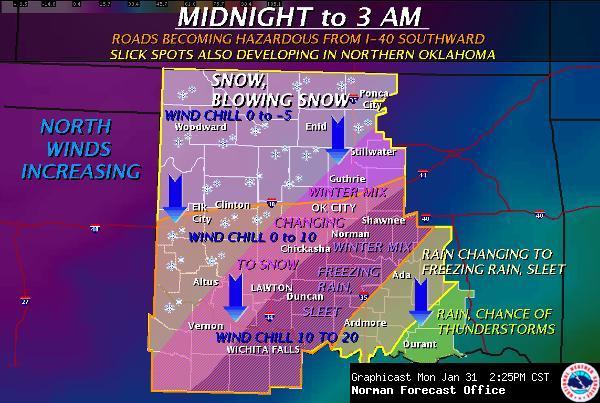
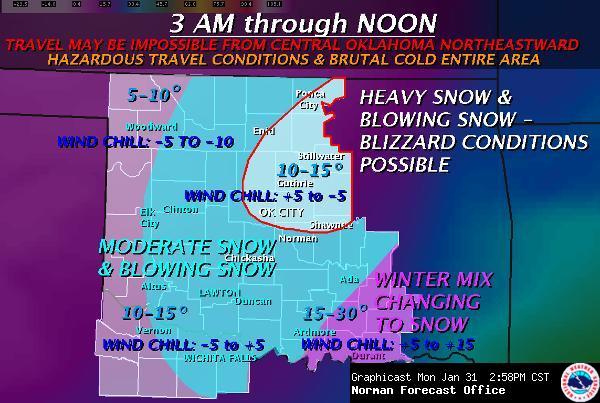
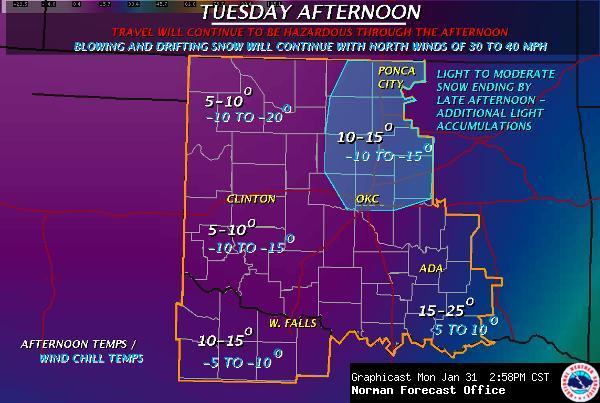
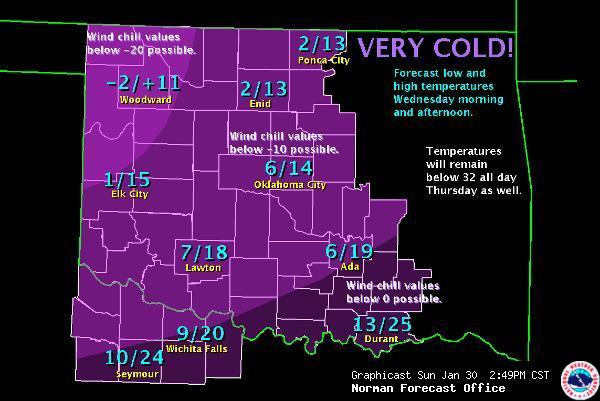
Nearly half of the U.S. and about 1/3 of the nation’s population is bracing for a major winter storm, to take place today through Wednesday or so. Since there’s a lot that could be said, and I don’t have a lot of time for an in-depth post, I’ll just post some graphics from the National Weather Service.

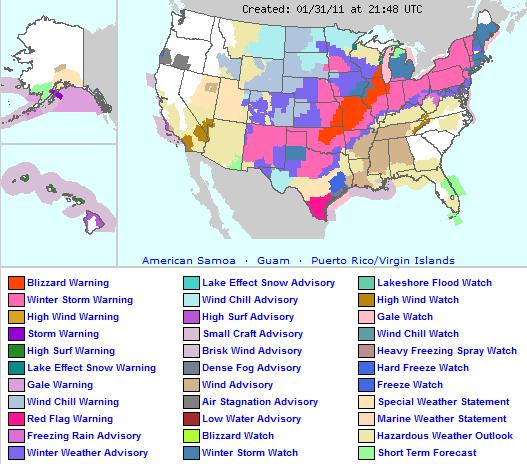
I might add that to my knowledge, this is the first blizzard warning that I have ever been under (I missed the Christmas Eve 2009 blizzard, which was the first blizzard in central Oklahoma in modern history and dumped 13.5 inches of snow on Oklahoma City, with several-foot drifts).
The National Weather Service has been using the following statements to describe this storm (taken from The Weather Channel):
-
Norman, OK: “Obvious analog would be Christmas Eve ’09. For some this may be as bad or worse.“
-
Kansas City, MO: “This could end up being one of the more significant weather events in the last 20 years in Missouri.“
-
St. Louis, MO: “Potentially historic winter storm headed for region.“
-
Milwaukee, WI: “Paralyzing blizzard“
-
Grand Rapids, MI: “Travel…and commerce in general…could be paralyzed with near record-breaking snowfall.“
-
Indianapolis, IN: “Could result in devastating conditions for central Indiana. Long duration power outages appear possible.”
Note: we could get more snow than this, and with the winds, several-foot snow drifts are possible
Currently, here in Norman, it’s mostly cloudy, dry, 45 °F, with a north wind of about 15 mph. It’s hard to believe that within 24 hours we could have several inches of snow on the ground!
Permalink
Posted in Non-US Weather, Tropical Weather at 2:47 pm by Rebekah
Yesterday I posted forecasts for a new tropical cyclone, Yasi, that had formed near Vanuatu. Yasi has strengthened considerably over the past 12 or so hours, and is currently a Category 3 severe tropical cyclone on the Australian scale (Category 2 on the Saffir-Simpson scale), with a maximum 10-minute wind speed of 98 mph (156 kph) and a minimum pressure of 960 mb. Maximum wind gusts are estimated to be near 138 mph (221 kph). Yasi is moving westward at 25 mph (40 kph).
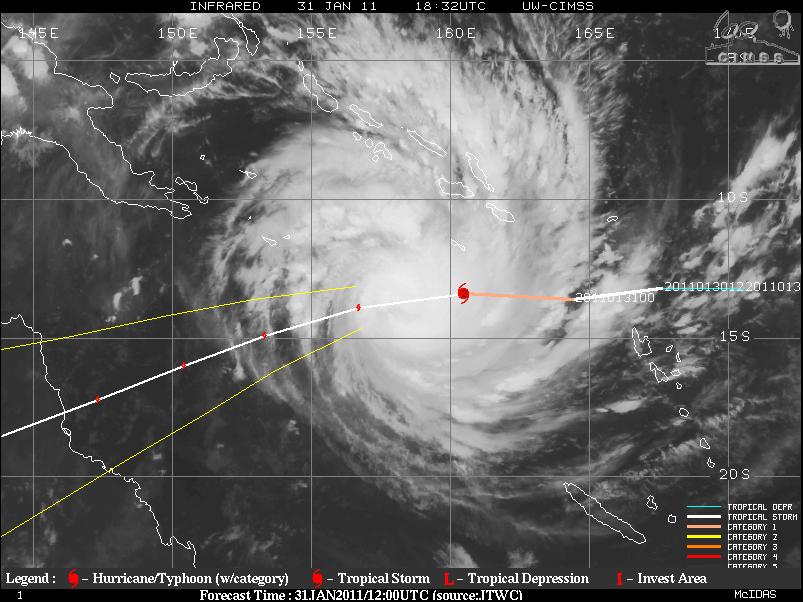
Infrared satellite image of Yasi at 1830 Z (4:30 am Australian Eastern Standard Time), from UW-CIMSS (see this website for the latest data such as sea-surface temperatures, wind shear, satellite images, etc.)
Yasi’s track has shifted a bit further north, so the tropical cyclone is now forecast to make landfall Wednesday night / Thursday morning (Australian time) near Cairns/Innisfail, Queensland. Yasi is over some pretty warm waters and a low shear environment (see this blog post for info on how tropical cyclones form and strengthen), so more strengthening is expected.
The Australian Bureau of Meteorology is calling for Yasi to peak in strength late Wednesday afternoon (Australian time) as a Category 4 cyclone (on both the Australian and the Saffir-Simpson scales) with maximum sustained winds of 121 mph (193 kph) and a minimum central pressure of 939 mb. The cyclone may weaken just a bit before making landfall, but it is likely that it will make landfall as a Category 4 storm.
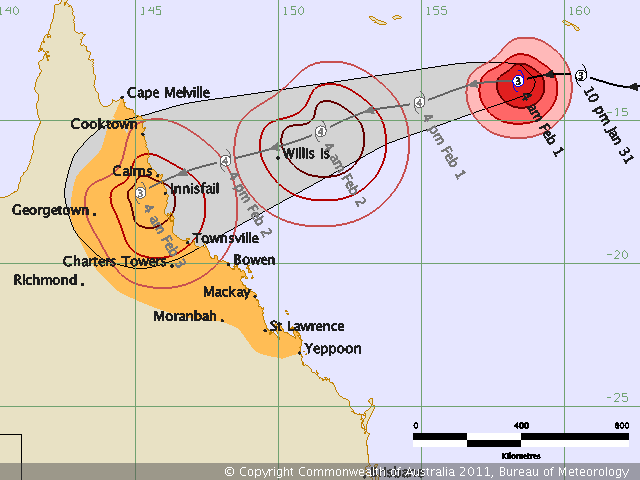
Yasi’s forecast strength and track, issued by the Bureau of Meteorology at 4 am Australian Eastern Standard Time
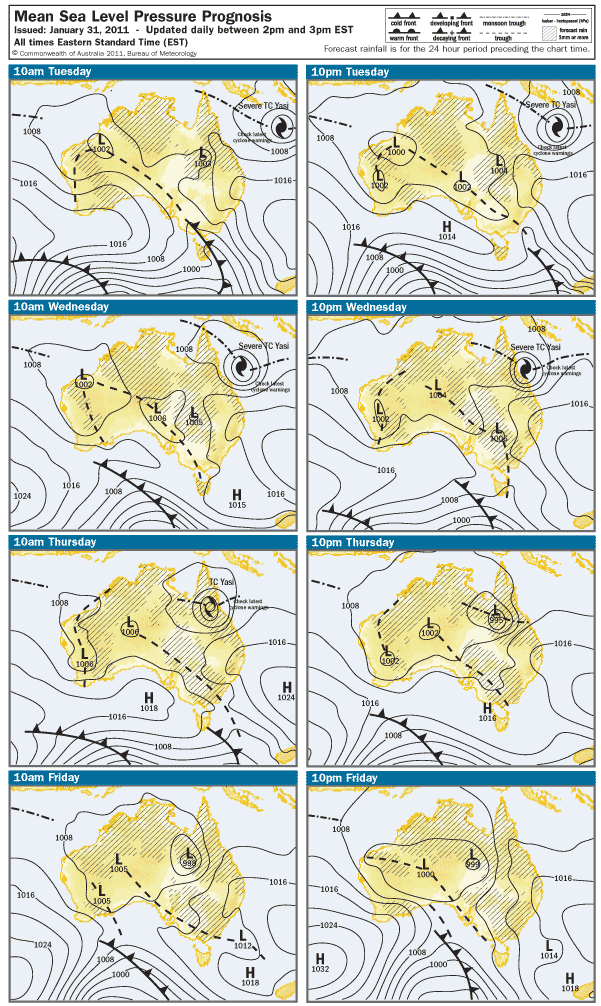
Surface map forecast for the next few days, from the Bureau of Meteorology
GFS model’s 12Z run (valid at 18Z Wednesday, or 4 am Thursday, Australian Eastern Standard Time), showing a more southern track, more towards Townsville (map from Weather Online UK):
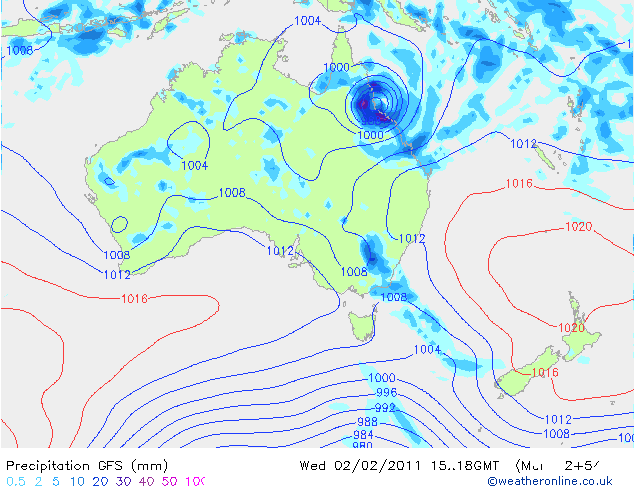
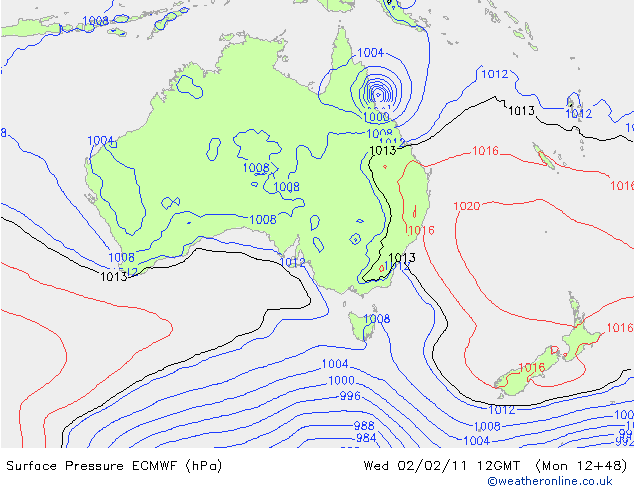
ECMWF model’s 12 run (valid at 12Z Wednesday, or 10 pm, Australian Eastern Standard Time), from Weather Online UK:
To keep up-to-date with the Bureau of Meteorology’s latest forecast tracks and tropical cyclone advice, see the tropical cyclone section of their webpage. Another good website with tropical cyclone tracks and information, that I have yet to mention, is Weather Underground.
Permalink
Posted in Weather Education at 8:00 am by Rebekah
Today’s post in the weather education series is on moisture in the atmosphere (e.g., phases, measurements, etc.), one of the seven elements of weather (temperature, pressure, wind, moisture, clouds, precipitation, and visibility).
————————————————–
Phases of Water
Water comes in three phases: gas (water vapor), liquid, and solid (ice). The following figure shows the names for the different phase changes.
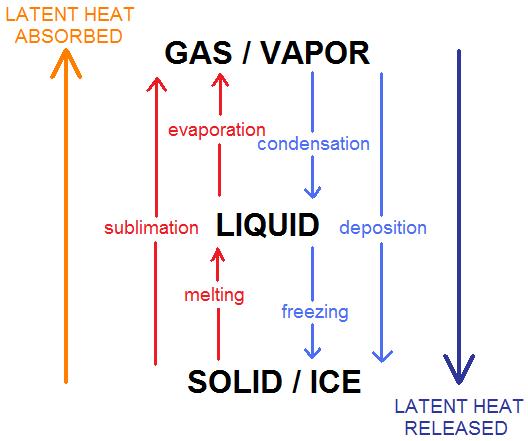
Note that when water goes to a higher energy state (read: the molecules are moving faster so the temperature is higher), latent heat energy is absorbed, cooling the atmosphere.
Think about it: when you want to melt some ice, you have to apply some heat…but where does the heat go? The heat is absorbed by the ice, allowing it to melt and then leaving the environment cooler than it was before. Also, think about how you feel cooler when you get out of a pool: water droplets on your skin evaporate, drawing heat from your body and thus leaving you feeling cooler.
The reverse is true as well; when water goes to a lower energy state (e.g., ice to liquid or vapor), latent heat energy is released, warming the atmosphere.
Dewpoint vs. Relative Humidity
Atmospheric moisture can be measured in a variety of ways, the most common being dewpoint temperature and relative humidity.
Dewpoint temperature is an absolute measure of moisture, and the units are the same as those of air temperature (°F, °C, K). The dewpoint is basically the temperature at which the air would reach saturation, if the temperature were to drop. Thus, the higher the dewpoint, the higher the moisture. Dewpoints above 60 °F are indicative of humid conditions, while dewpoints below 40 °F are generally indicative of dry conditions.
Relative humidity is given as a percent, and as it is a relative measure of moisture, a higher relative humidity does NOT necessarily mean there is a high amount of moisture in the air…it ONLY means that the air is closer to saturation.
Think about it: if the air temperature is 30 °F, the dewpoint temperature must be less than or equal to 30 °F (remember, the dewpoint temperature can never exceed the air temperature). So even if the relative humidity is 90%, you still have dry air…it just means you might be close to saturation (maybe it’s foggy or snowing).
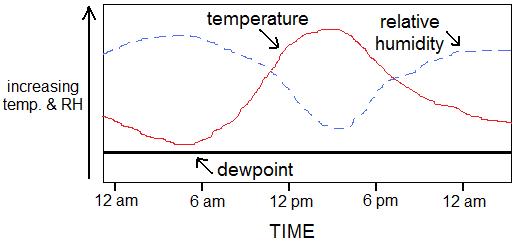
Now, let’s say the dewpoint temperature stays the same for 24 hours…what happens to the relative humidity? As the air temperature goes up, the relative humidity goes down (see figure, above)…as the air temperature rises during the day, the difference between the air temperature and the dewpoint becomes greater (thus the relative humidity goes down)…and as the air temperature falls at night, the difference between the air temperature and the dewpoint becomes less (thus the relative humidity goes up, and you may get dew on the grass).
————————————————–
Come back next Monday as we talk about clouds, the next element of weather.
Permalink
« Previous Page — « Previous entries « Previous Page · Next Page » Next entries » — Next Page »


